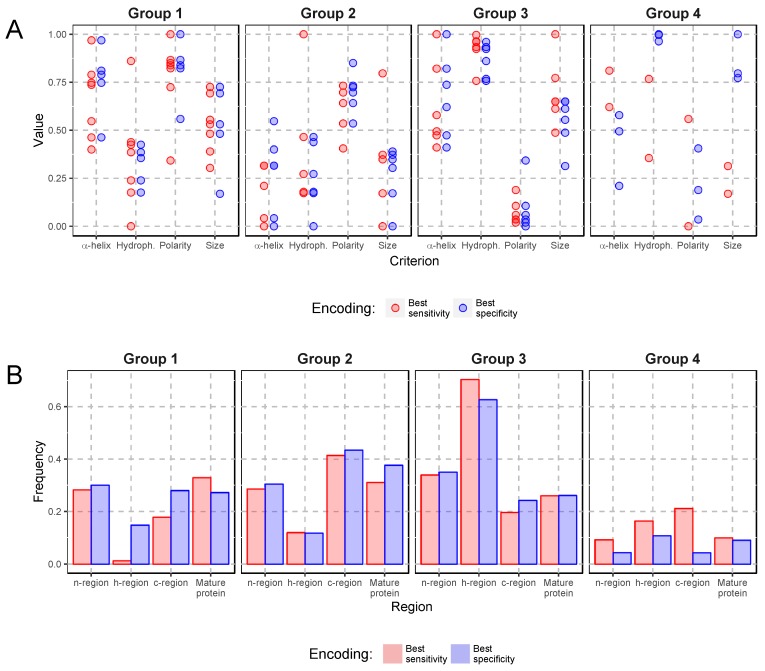
Figure 4.
Comparison of amino acids classified into four groups providing the best sensitivity and specificity in the SP recognition. Normalized value of properties for particular amino acids represented by points (A). Frequencies of amino acids from the four groups in different regions of signal peptide and mature proteins (B).

