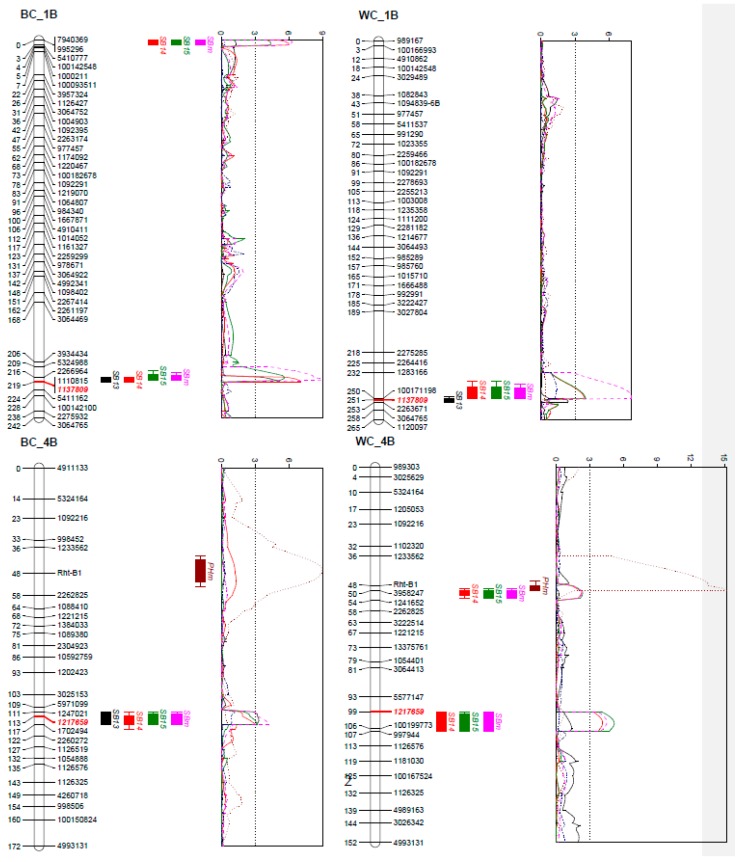
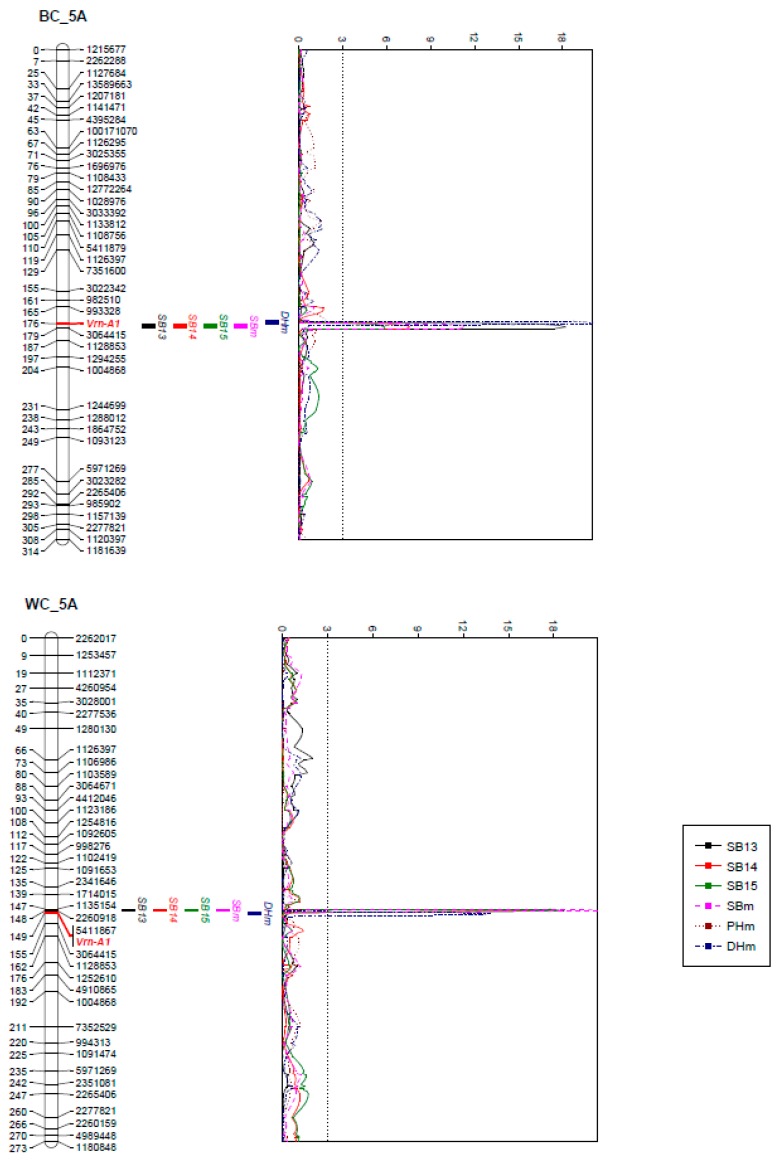
Figure 2.
QTL profiles for spot blotch (SB), plant height (PH) and days to heading (DH) on chromosomes 1B, 4B and 5A in the “BARTAI” × “CIANO T79” (BC) and “WUYA” × “CIANO T79” (WC) populations. Genetic distances are shown in centimorgans to the left of the chromosomes. A threshold of 3.0 is indicated by a dashed vertical line in the LOD graphs. Only framework markers are presented except for the QTL regions, and the markers in the QTL regions shared between the two populations are highlighted in red and in Italic.


