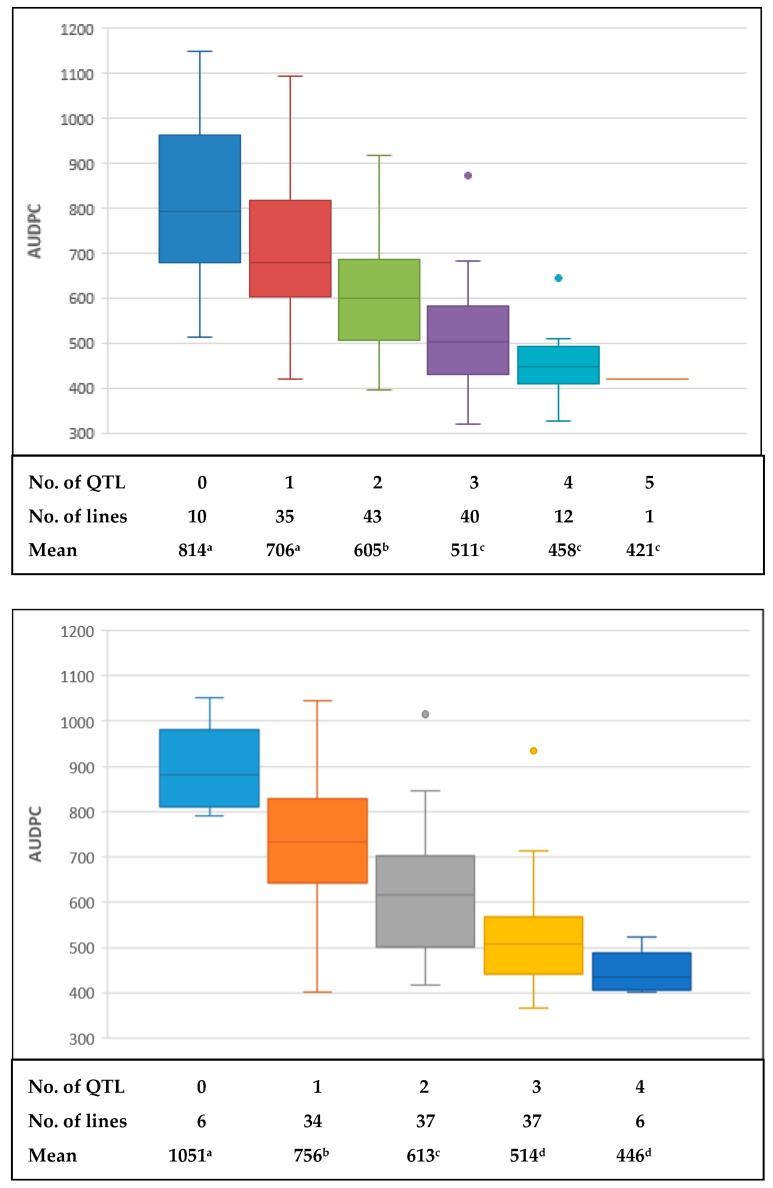
Figure 3.
Boxplot for effects of stacking different numbers of QTL in the “BARTAI” × “CIANO T79” (top) and “WUYA” × “CIANO T79” (bottom) populations. Mean AUDPC values over three experiments were used here. Different letters following mean values of different groups indicate significant difference at alpha = 0.01.

