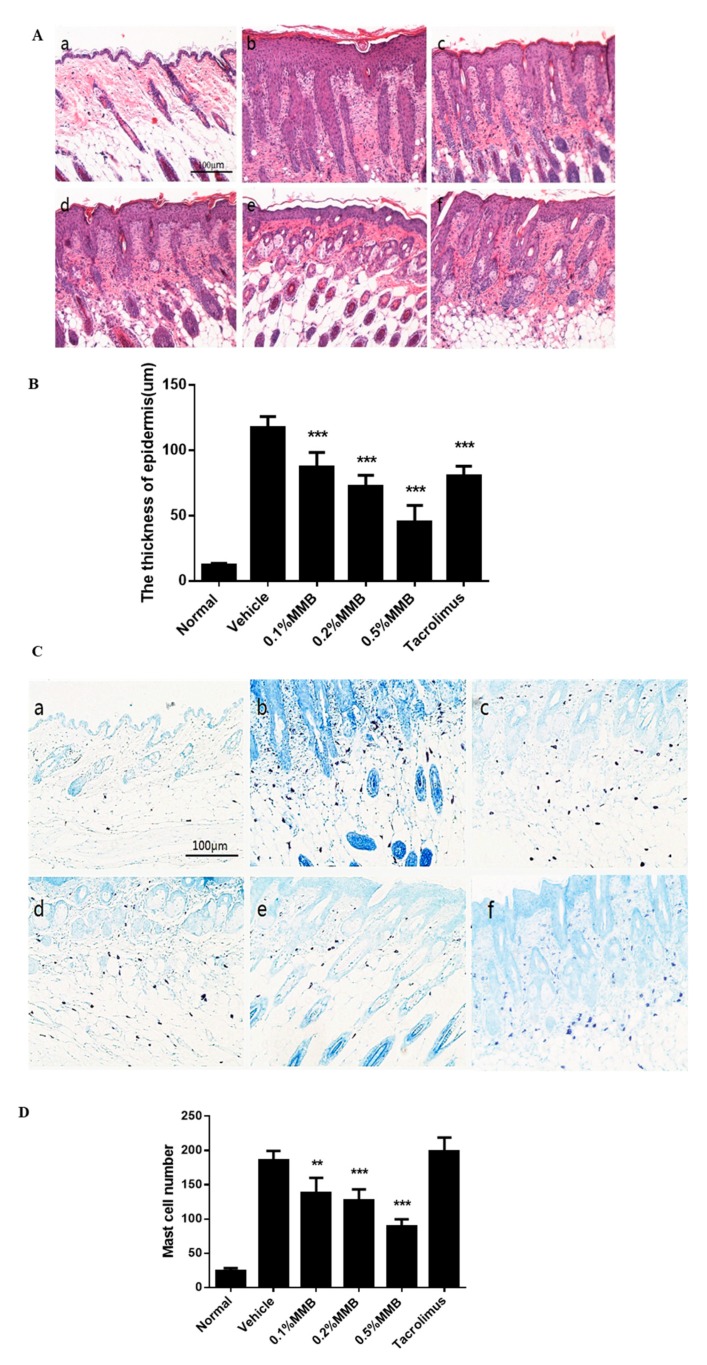
Figure 2.
Skin lesions were stained with H&E and toluidine blue (×100 magnification, A,C) to represent the thickness of epidermis and number of mast cells respectively (×200 magnification, B,D). (a) The normal group, (b) the vehicle group, (c) the 0.1% MMB group, (d) the 0.2% MMB group, (e) the 0.5% MMB group, and (f) the tacrolimus group. Values are mean ± SD (n = 6). ** p < 0.01, *** p < 0.001 versus the vehicle group.

