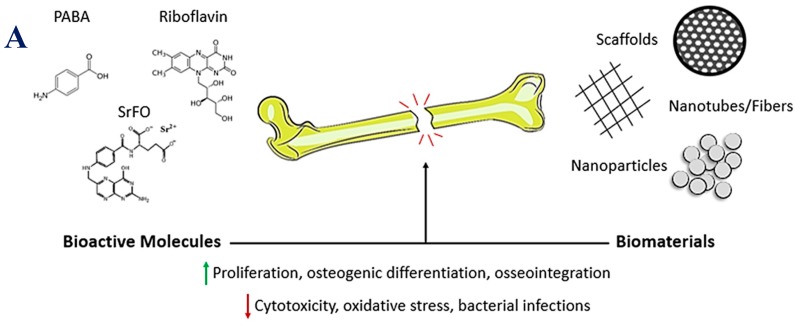
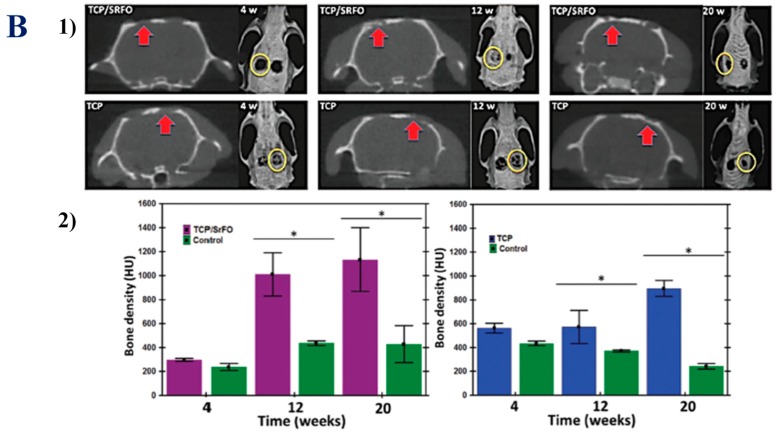
Figure 2.
B-vitamins in bone repair. (A) Schematic diagram showing the different options to promote bone regeneration processes. Up-arrows mean enhanced. Down-arrows mean decreased. (B) Micro-computed tomography images of cranial defects treated with TCP and TCP/SrFO scaffolds at 4, 12 and 20 weeks and defect closure on the side of the implants form the coronal plane (arrows) and 3D images (circles) (1) and bone density of the radiographic density (HU) in cranial defects (2) (* p < 0.001). Figure 2B is reproduced from [16] with permission from the Royal Society of Chemistry.


