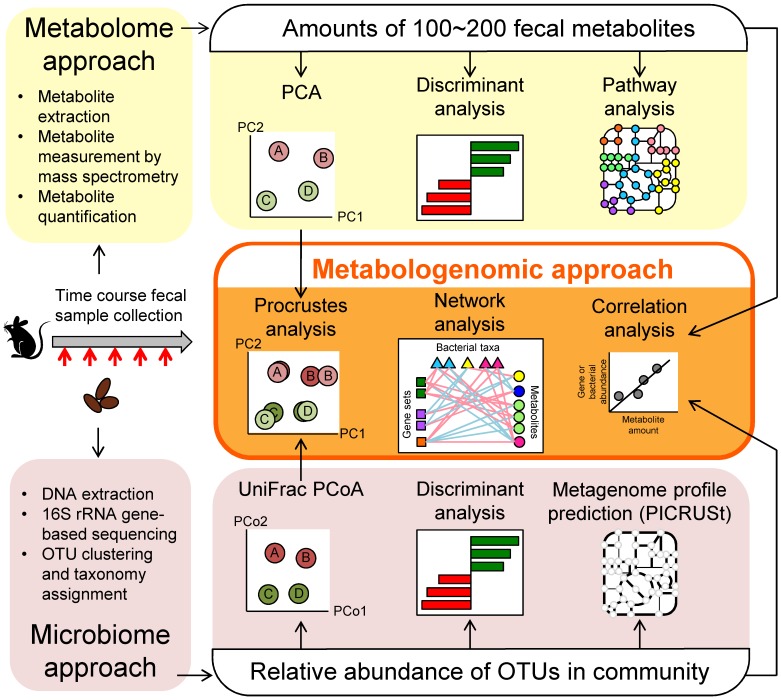
Figure 1.
Overview of metabologenomic analysis workflow. Steps used for evaluation of metabolome profiles are summarized in the top row (yellow shading). This process starts with measurement of the amount of fecal metabolites to obtain profiles for the 100–200 metabolites. These metabolome profiles then are compared using Principal Component Analysis (PCA), discriminant analysis, and pathway analysis. Steps used for evaluation of microbiome profiles are summarized in the bottom row (pink shading). This process starts with the sequencing of the community’s 16S rRNA-encoding genes to clarify the relative abundance of operational taxonomic units (OTUs). Microbial memberships and structures are compared using UniFrac principal coordinate analysis (PCoA) and discriminant analysis. Additionally, Phylogenetic Investigation of Communities by Reconstruction of Unobserved States (PICRUSt) is used to predict metagenomic profiles. Steps for metabologenomic analysis are summarized in the central part of the figure (middle row; orange shading). The PCoA and/or PCA plots are used for Procrustes analyses. The relative abundances of microbial taxonomy and/or metagenome profiles and amounts of metabolites then are used for correlation analysis and network analysis.

