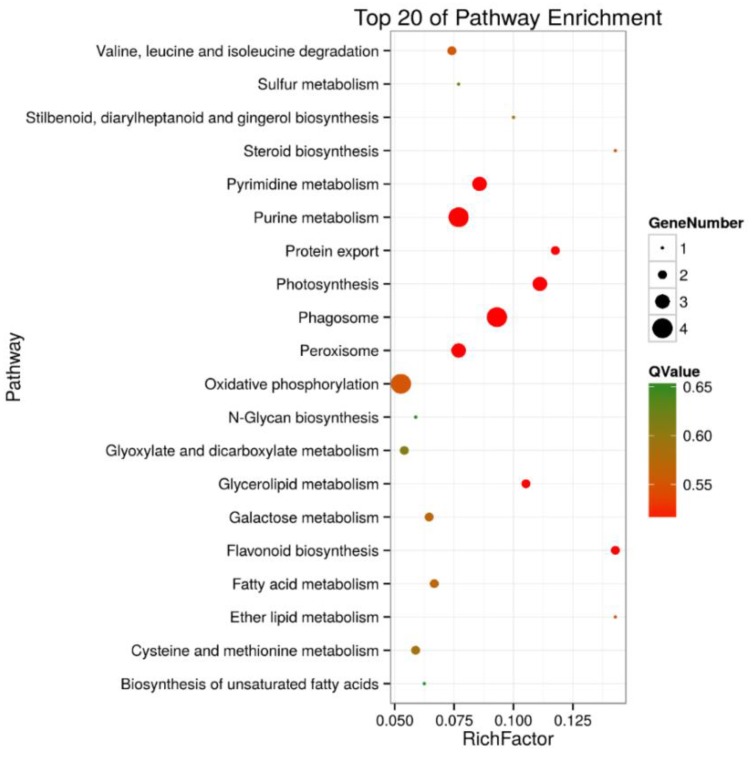
Figure 5.
Top 20 pathway enrichments of DEPs in roots of salt-treated sugar beet plants compared with controlled plants. The Y-axis indicates the KEGG pathway, the X-axis indicates the rich factor. The dot size indicates the number of DEPs of the pathway, and the dot color indicates the Q-value. Rich factor indicates the number of differentially abundant proteins participating in a KEGG pathway as a proportion of proteins involved in the pathway in all identified proteins. A P-value less than 0.05 was defined as statistically significant.

