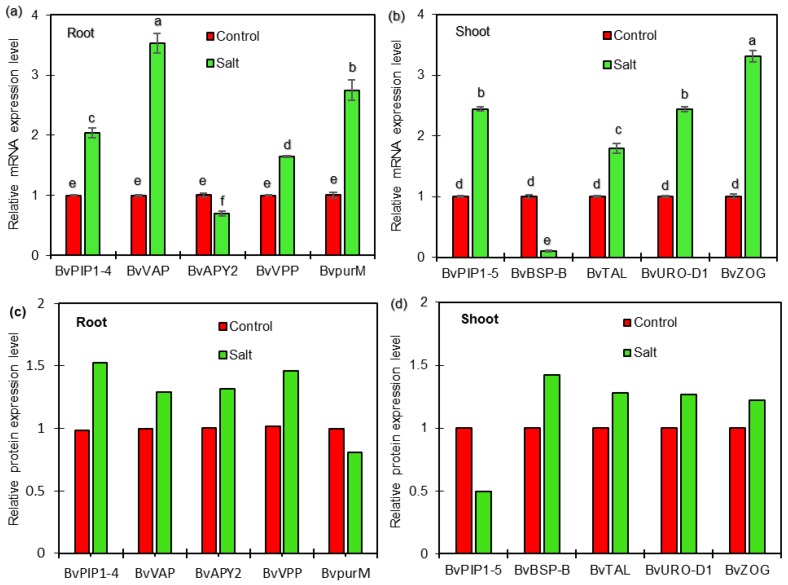
Figure 7.
qRT-PCR expression analysis of selected genes with corresponding protein change in roots (a,c) and shoots (b,d) of sugar beet plants exposed control and 50 mM NaCl for 72 h. Relative mRNA levels in salt-treated plants were normalized against the control plants. Values are mean ± SE of three independent experiments. Columns with different letters indicate significant differences at p <0.05 (Duncan’s test). The relative protein expression levels of selected protein were derived from proteomics data of the present iTRAQ-based experiment. The selected proteins were BvPIP1-4 (Unigene0033986), BvVP (Unigene0011701), BvpurM (Unigene0024368), and BvVAP (Unigene0010790) in roots; BvPIP1-5 (Unigene0033990), BvTAL (Unigene0005386), BvURO-D1(Unigene0000482) and BvZOG (Unigene0016372) in shoots, respectively. BvACTIN was used as an internal control to normalize the transcript levels of all expression analyses.

