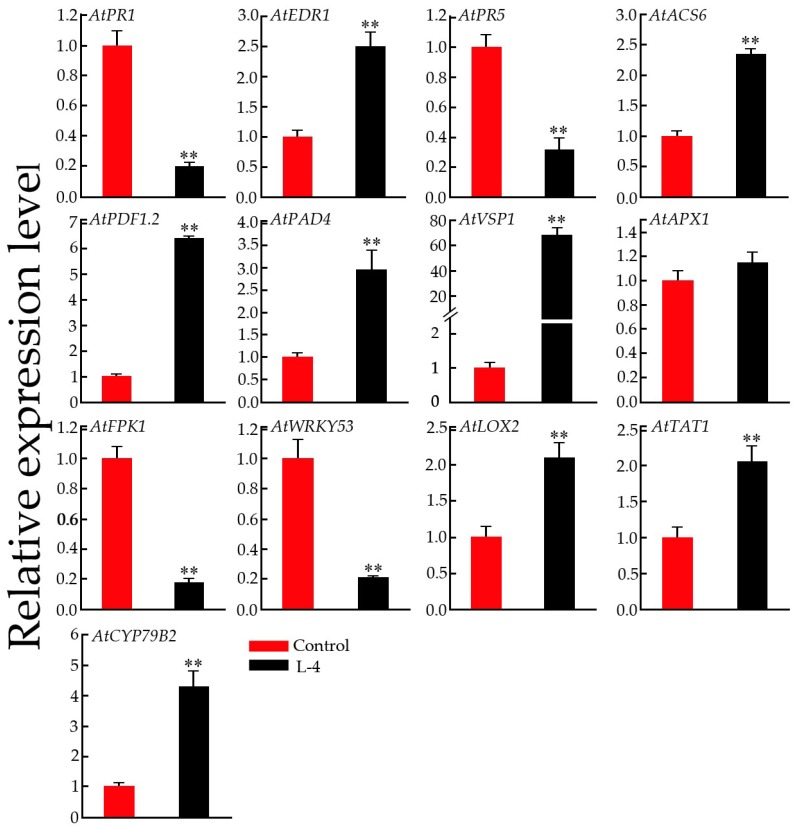
Figure 9.
QPCR analysis of the expression levels of defense-related genes in the control (Col-0) and transgenic (L-4) Arabidopsis plants. Arabidopsis actin 1 (AtActin1) was used as an internal standard to normalize the templates. The relative mRNA levels are represented as the mean ± SD (n = 3). Statistically significant differences were assessed using Student’s t-test (** p < 0.01).

