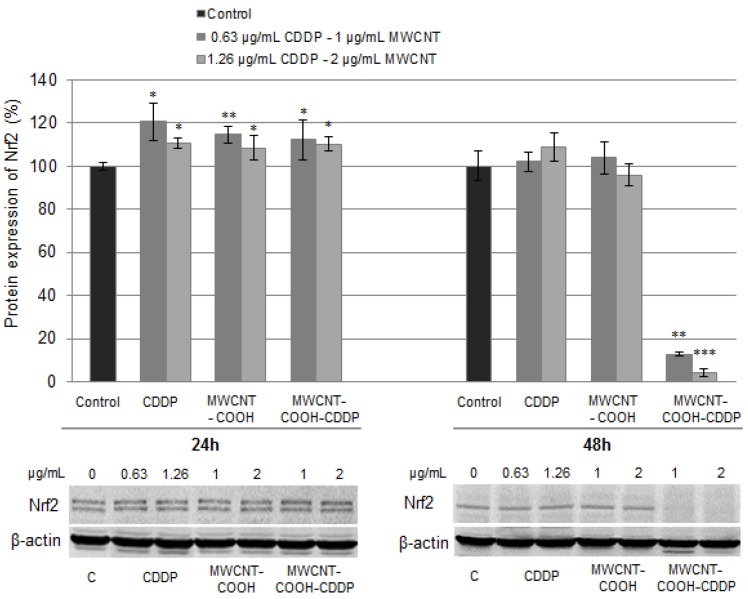
Figure 12.
Relative protein expression of Nrf2 after the exposure of MDA-MB-231 cells to MWCNTs (0.5–4 µg/mL) and CDDP (0.316–2.52 µg/mL) for 24 h and 48 h. The graph is the correspondent quantification of blots images presented below. The results are calculated as the mean ± SD of 3 replicates and represented relative to control. * p < 0.05, ** p < 0.01, *** p < 0.001 vs. control.

