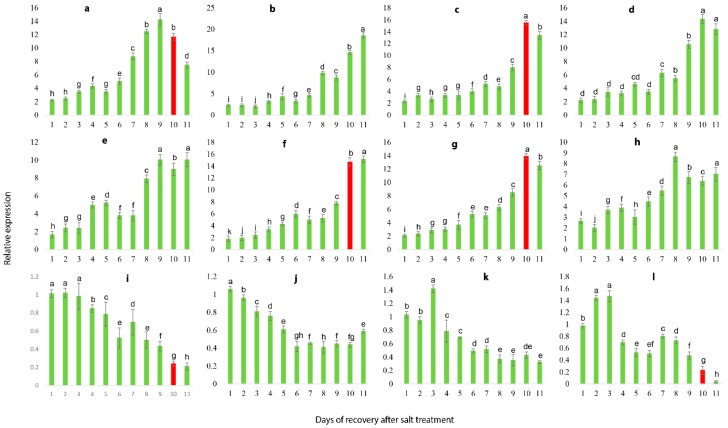
Figure 11.
Expression patterns of the 12 candidate genes following the 11 days of 3.0% SS. Red bars indicate the sharp change in gene expression levels. Values represent mean ± SE (n = 3) and the significance level of 0.05 was used for different letters above bars. Genes with continual increasing or decreasing expression patterns were selected as candidate genes. a: VIT_05s0020g03740.t01, b: VIT_19s0015g01070.t01, c: VIT_05s0049g00520.t01, d: VIT_13s0067g02360.t01, e: VIT_04s0023g00530.t01, f: VIT_05s0049g01070.t01, g: VIT_06s0004g05670.t01, h: VIT_10s0003g01810.t01, i: VIT_07s0005g00160.t01, j: VIT_11s0052g01180.t01, k: VIT_14s0128g00020.t01, l: VIT_05s0062g00300.t01.

