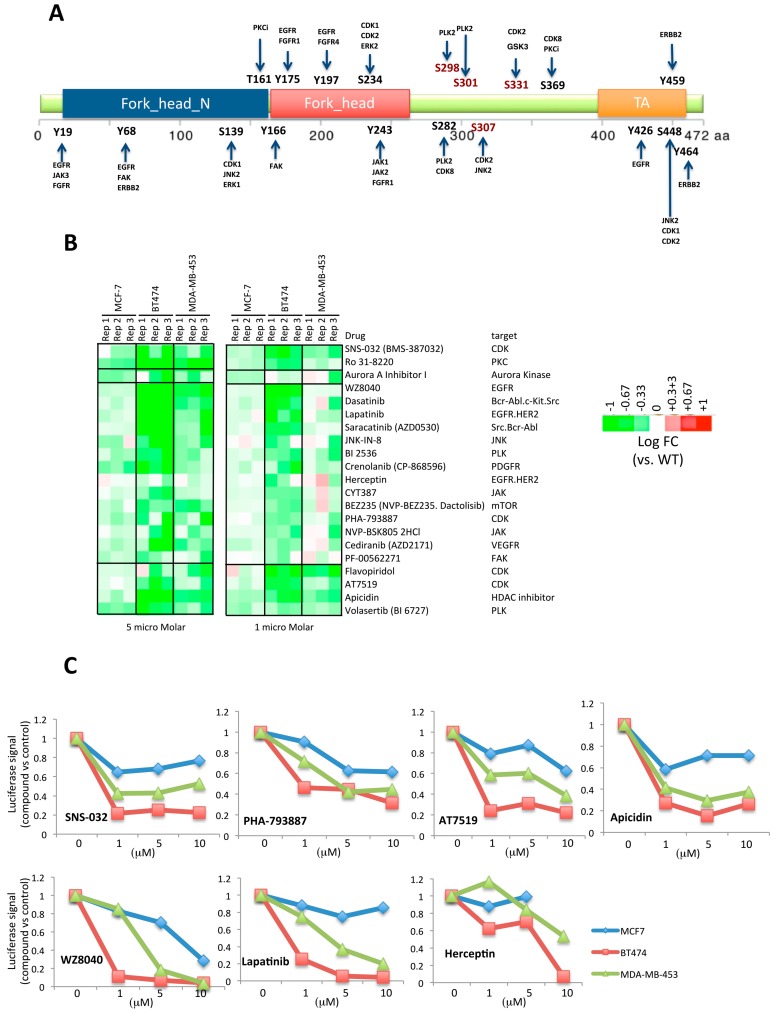
Figure 3.
Validation of chemicals by the second screening. (A) Diagram showing potential FOXA1 phosphorylation sites and corresponding kinases. The prediction of FOXA1 phosphorylation sites was performed with GPS 3.0, and corresponding kinases that overlapped with positive targets in the first chemical screening were identified. Both overlapping kinases and their potential sites are labeled. (B) Heatmap showing the result of compounds with a significant change in luciferase expression. 45 chemicals were used for the second chemical screening for three cell lines and two concentrations (5 and 1 microM). The heatmap illustrates the log2 fold change in luciferase expression (drug treatment vs. control) of cells treated with the 21 compounds with a significant p value. (C) Dose responses of compounds with a significant inhibitory effect in the expression of luciferase. The plots represent the relative signal of the compounds targeting the receptor tyrosine kinases HER2/EGFR and the cyclin-dependent kinases (CDK) vs. control treated cells. The average of three independent experiments for different concentrations tested (0, 1, 5, and 10 micro Molar) is plotted.

