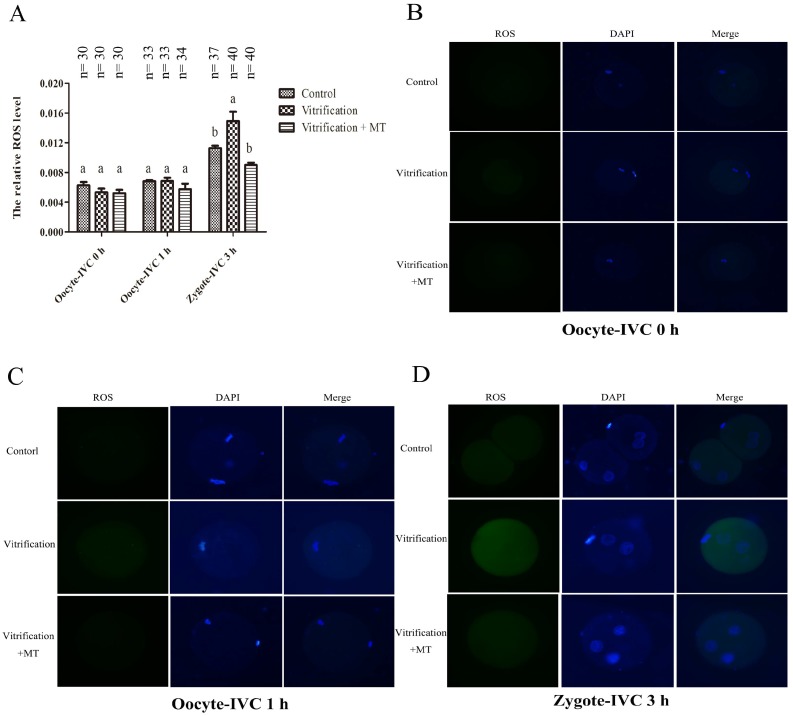
Figure 2.
Reactive oxygen species (ROS) levels in mouse MII oocytes and their parthenogenetic zygotes. The dynamic change of ROS levels in mouse oocytes and their parthenogenetic zygotes (A) ROS staining in oocytes (B,C) and their parthenogenetic zygotes (D) Fluorescence intensities were correlated with intracellular levels of ROS. Different superscripts (a and b) represent treatment differences within panels (p < 0.05). After warming, mouse MII oocytes were in vitro cultured for 0 h (Oocyte-IVC 0 h) or 1 h (Oocyte-IVC 1 h) in M2 medium. The oocytes cultured for 1 h were selected for parthenogenetic activation (PA). During the entire experiment, all the media were supplemented with 10−9 mol/L (Vitrification + MT group) or 0 mol/L melatonin (Vitrification group). Fresh oocytes without melatonin (MT) treatment were used as controls (Control group). After PA and in vitro culture for 3 h, the resulting zygotes (zygote-IVC 3 h) were used for ROS detection together with mouse oocytes before PA. The values (the relative ROS levels)) are shown as mean ± SEM. The experiment was replicated at least three times. Original magnification 200×.

