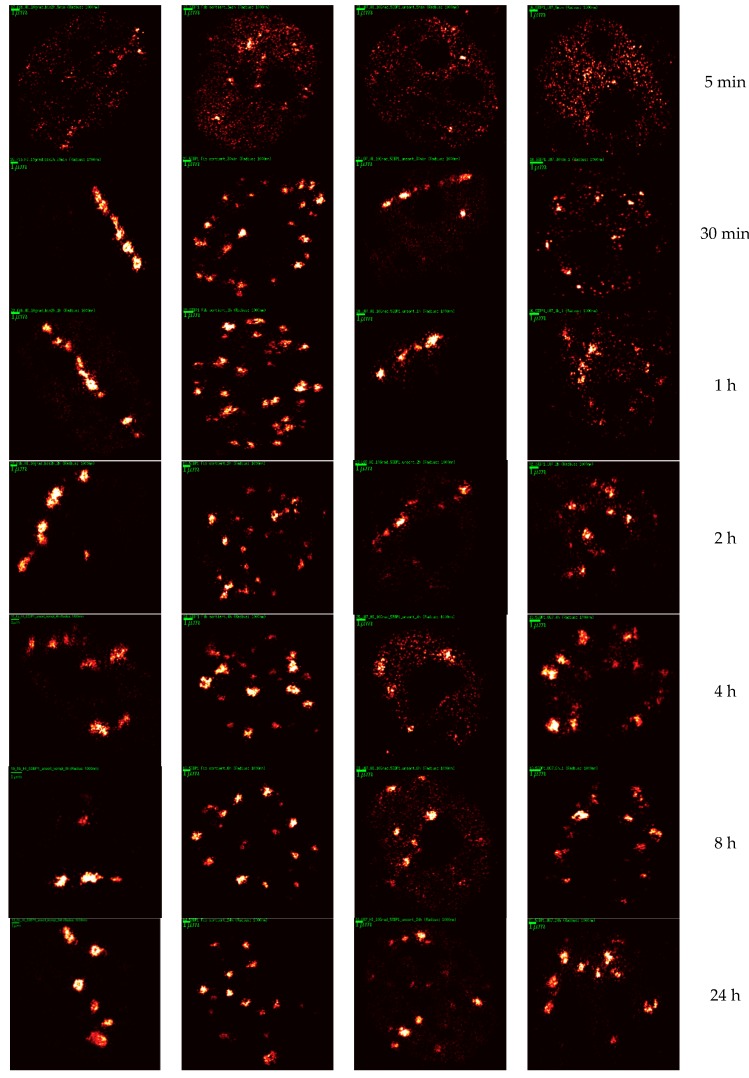
Figure 2.
2D density SMLM images of 53BP1 repair proteins. Typical examples are shown for fluorescently-labeled 53BP1 proteins in NHDF cells (A,B) and U87 cells (C,D) after 1.3 Gy tangential 15N-irradiation (A,C) (10° angle between the ion beam and the cell layer) and 4 Gy perpendicular 15N-irradiation (B,D) (90° angle between the ion beam and the cell layer). Along this time line, the samples were taken as aliquots of the same culture and fixed at different time points (5 min, 30 min, 1 h, 4 h, 8 h and 24 h) after irradiation. For comparison, examples of non-irradiated control cells are presented. The density images do not show all signal points detected but instead encode the number of neighbors of each signal within a circle of 1 µm radius by the point intensity—the number of signals in the given surroundings around one signal grows as the color of the point changes from red to white. The green bars equal to 1 µm.


