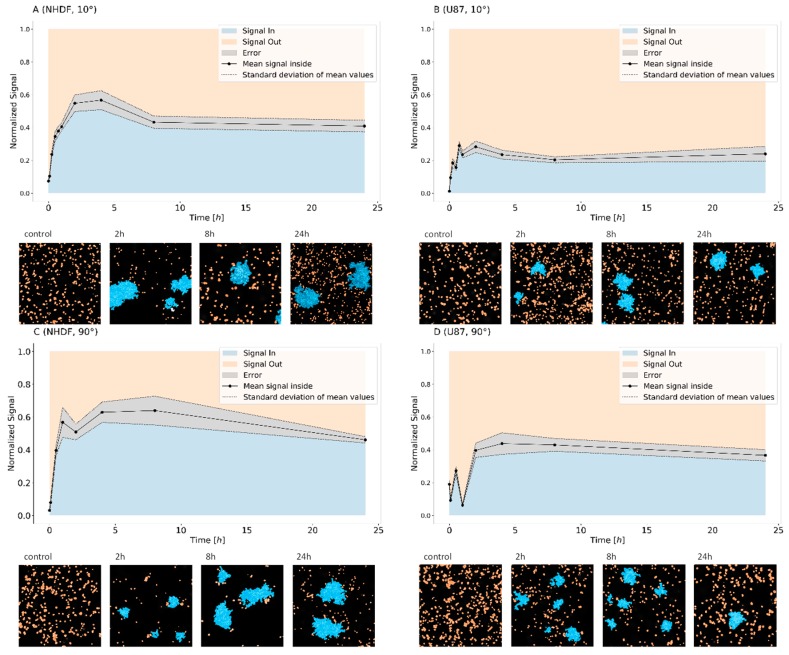
Figure 3.
Relative amounts of 53BP1 signals detected within (blue) and outside (orange) repair clusters as defined for SMLM (see Section 4.6). Graphs: Mean values and margins given by the standard deviation are depicted in gray. The values are always normalized to the mean number of signals detected at a given time point. The data are presented for NHDF fibroblasts (A,C) and U87 cells (B,D) after 1.3 Gy tangential 15N-irradiation (A,B) (10° angle between the ion beam and the cell layer), and 4 Gy perpendicular 15N-irradiation (C,D) (90° angle between the ion beam and the cell layer). Images: The pointillist images represent examples of sections of cell nuclei with labeling points inside (blue) and outside (orange) clusters at the given time points. The samples were taken as aliquots of the same culture at different time points (from 5 min to 24 h) after irradiation. For comparison, examples of non-irradiated control cells are presented (=0 min).

