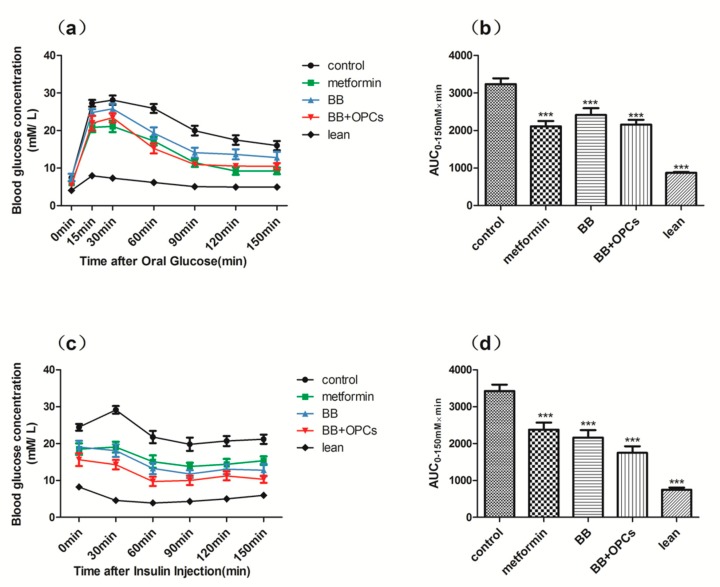
Figure 2.
Effects of the 5 weeks administration of compounds in the (a) OGTT and (c) IPTT in db/db mice with diabetes. (a) After 14 h of fasting, 0.35 g of glucose per kilogram of body weight was gavaged into mice and calculated as 0 min. Blood glucose levels were measured at the indicated times shown in the graph. (c) After 6 h of fasting, blood glucose concentrations were measured at the indicated time following intraperitoneal injection of 1 IU of insulin per kilogram of body weight. AUCs for (b) OGTT and (d) IPTT are shown in the graph. Data are presented as mean ± SEM of eight mice in each group. *** p < 0.001 vs. untreated control.

