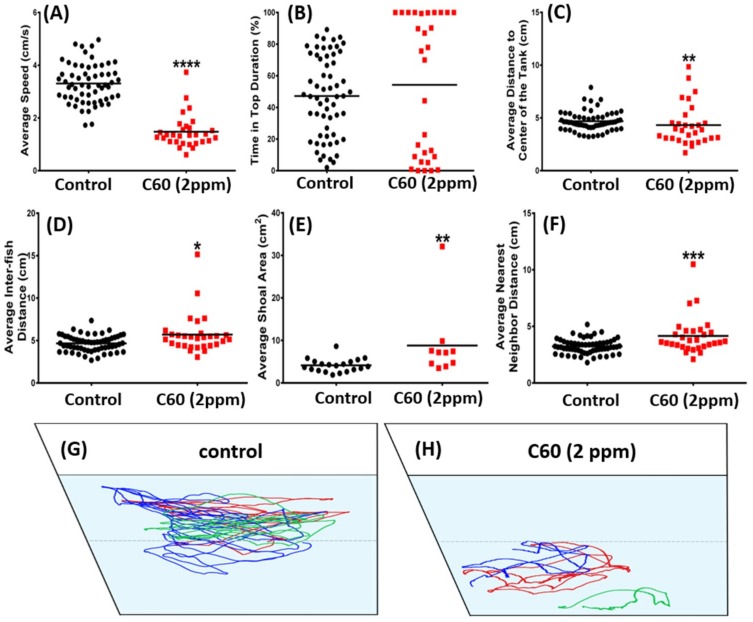
Figure 8.
Comparison of shoaling behavior endpoints between wild-type and C60 NPs-exposed zebrafish after nine-day exposure. (A) Average speed, (B) time in top duration, (C) average distance to center of the tank, (D) average inter-fish distance, (E) average shoal area, and (F) average nearest neighbor distance were analyzed. The swimming trajectories of the control (G) and C60 NPs-exposed fish (H) for shoaling test were recorded and compared. Three fish were tested for shoaling behavior and their trajectories were labeled by different color for clarifying their identity. The data are expressed as the means and were analyzed by Mann–Whitney test (n = 60 for control; n = 30 for C60 NPs-exposed fish; * p < 0.05, ** p < 0.01, *** p < 0.005, ****, p < 0.0001).

