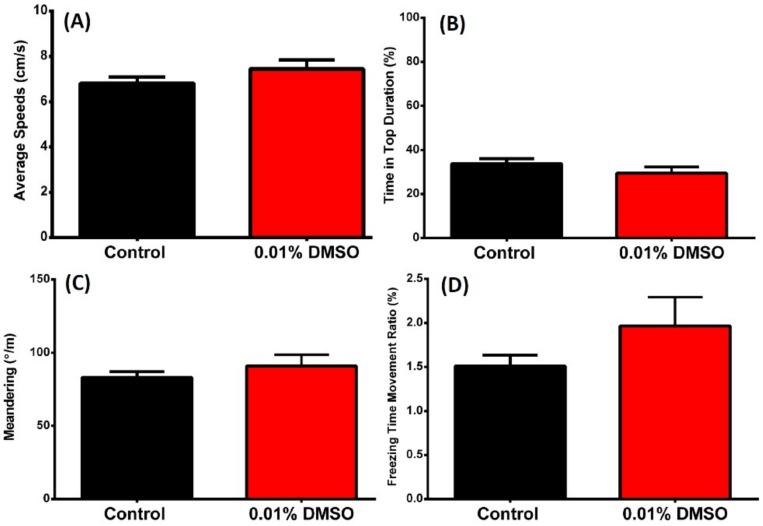
Figure A1.
Comparison of behavior endpoints between control and 0.01% DMSO-exposed zebrafish in 3D (three-dimensional) locomotion test after five-day exposure. (A) Average speed, (B) Time in top duration, (C) Meandering, (D) freezing time movement ratio were analyzed. The data are expressed as the mean ± SEM and were analyzed by t-test (n = 30 for control; n = 18 for 0.01% C60 NPs-exposed fish).

