Figure 2.
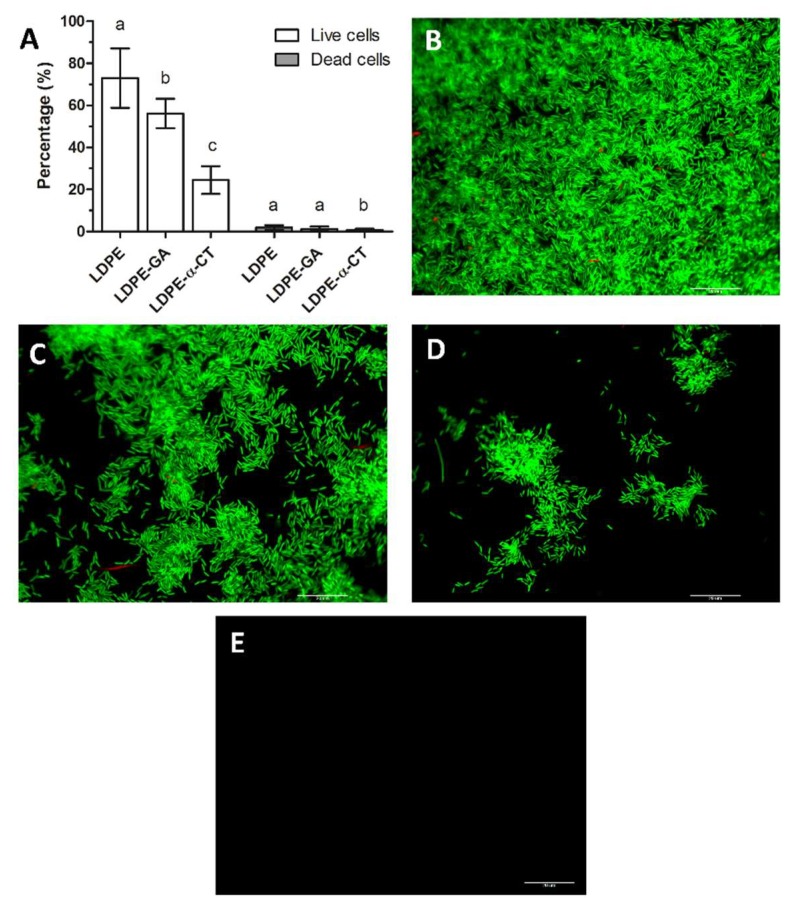
Epifluorescence microscope analysis. (A) Percentage of live and dead cells within the biofilm grown on non-functionalized (LDPE and LDPE-GA) and functionalized polyethylene surfaces (LDPE-α-CT). Data represent the mean ± standard deviation of four independent measurements. Letters a, b and c indicate significant differences (Tukey’s HSD, p ≤ 0.05) between the means of different surfaces. (B–D) Representative epifluorescence microscope images of E. coli biofilm stained with a Live/Dead BacLight viability kit and grown on LDPE (B), LDPE-GA (C), and LDPE-α-CT (D) surfaces (60×, 1.0 NA water immersion objective). Green fluorescence corresponds to E. coli live cells (λex: 480 nm and λem: 516 nm) and red fluorescence corresponds to E. coli dead cells (λex: 581 nm and λem: 644 nm). (E) Representative epifluorescence microscope image of LDPE, LDPE-GA, and LDPE-α-CT without biofilm and stained with a Live/Dead BacLight viability kit showing no detectable fluorescence. Scale bar = 20 µm.

