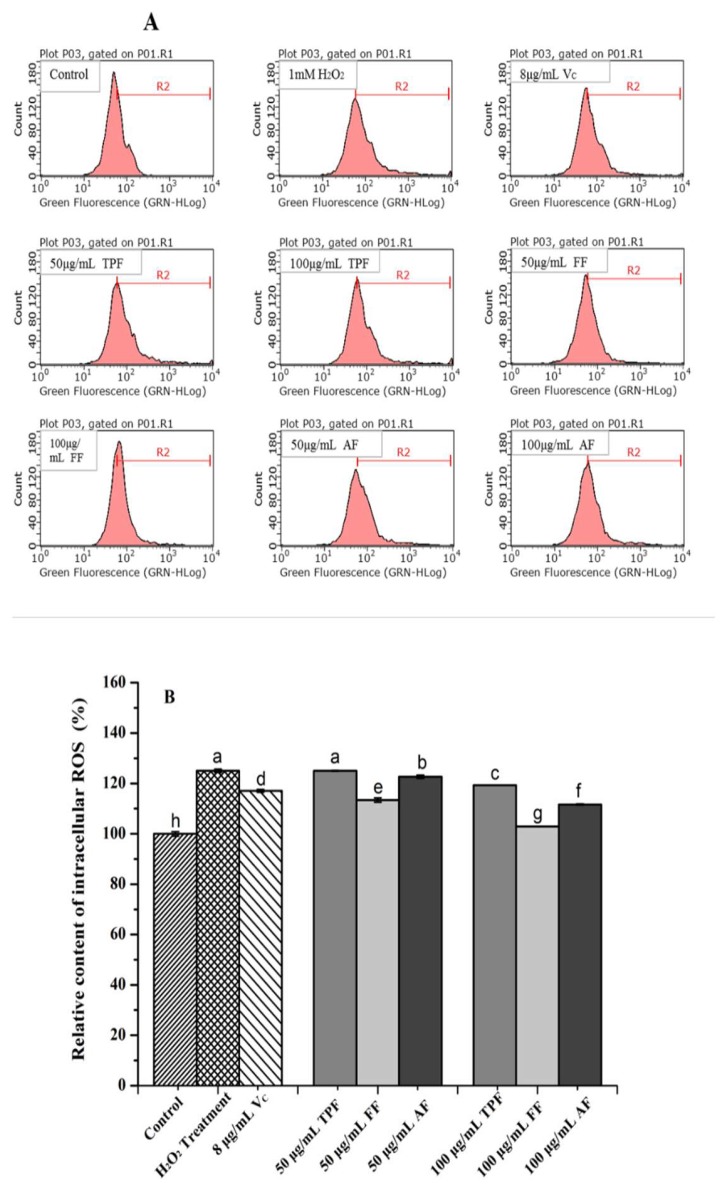
Figure 3.
The results of cellular reactive oxygen species (ROS) inhibitory effects of the different fractions from P. utilis fruits in H2O2-induced HepG2 cells: Flow cytometry analysis (A) and the relative amount of ROS in different groups (B). Means (bar value) with different letters are significantly different (p < 0.05).

