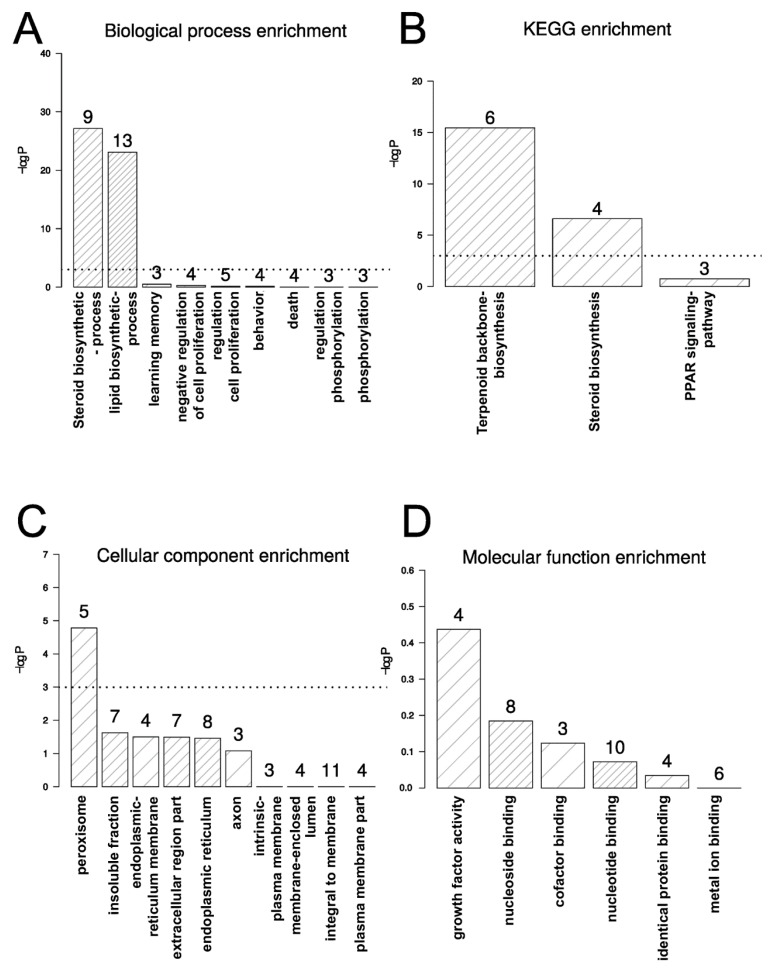
Figure 3.
Histograms depicting the functional enrichment for: (A) biological processes, (B) KEGG, (C) cellular component and (D) molecular function. The numbers above each bar represent the number of expressed genes identified as being significantly regulated for each of the displayed functional categories. The dotted line indicates −log (0.05).

