Figure 5.
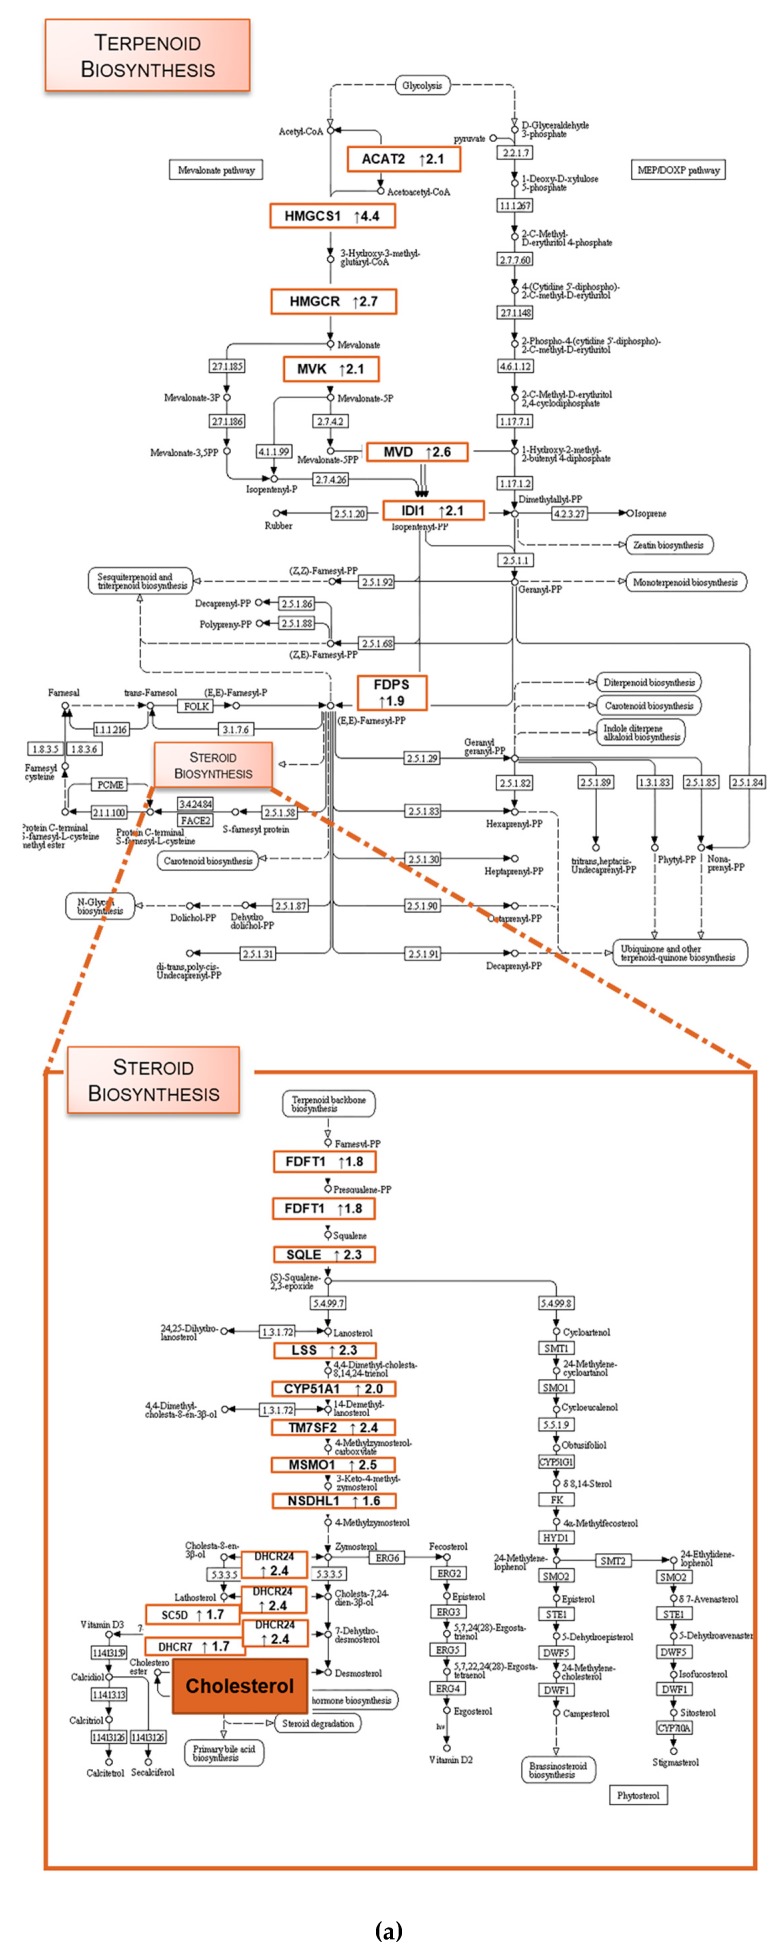
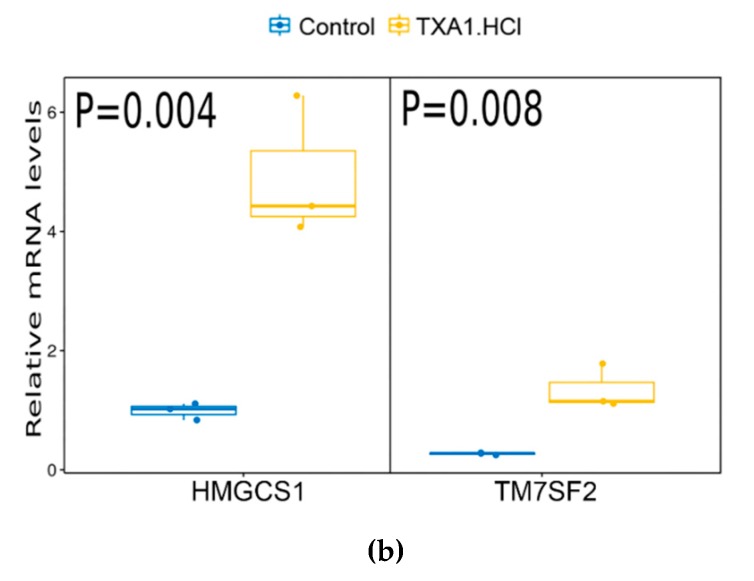
(a) KEGG pathways with significantly differential gene expression from this study were highlighted, including the direction of regulation (up or downregulation). Each colored box has the gene name abbreviated and a number representing the ≥1.5-fold relative to the control. KEGG pathway background images were adapted from www.genome.jp/kegg/ [21,22,23]. (b) HMGCS1 and TM7SF2 mRNA levels, analyzed by quantitative real-time PCR. Values are expressed after normalization for an endogenous control. Data plotted with ggplot and p value were calculated using t. test in R statistical programming language comparing TXA1.HCl vs control. Gene names: ACAT2, acetyl-coenzyme A acetyltransferase 2; HMGCS1, 3-hydroxy-3-methylglutaryl-coenzyme A synthase 1; HMGCR, 3-hydroxy-3-methylglutaryl-coenzyme A reductase; MVK, mevalonate kinase; MVD, mevalonate (diphospho) decarboxylase; IDI1, isopentenyl-diphosphate δ-isomerase 1; FDPS, farnesyl diphosphate synthetase; FDFT1, squalene synthase; SQLE, squalene epoxidase; LSS, lanosterol synthase; CYP51A1, cytochrome P450, family 51, subfamily A, polypeptide 1 (lanosterol 14 α-demethylase); TM7SF2, transmembrane 7 superfamily member 2 (Delta(14)-sterol reductase); MSMO1, methylsterol monooxygenase; NSDHL, NAD(P)-dependent steroid dehydrogenase; DHCR24, 24-dehydrocholesterol reductase; SC5DL, sterol-C5-desaturase-like; DHCR7, 7-dehydrocholesterol reductase.


