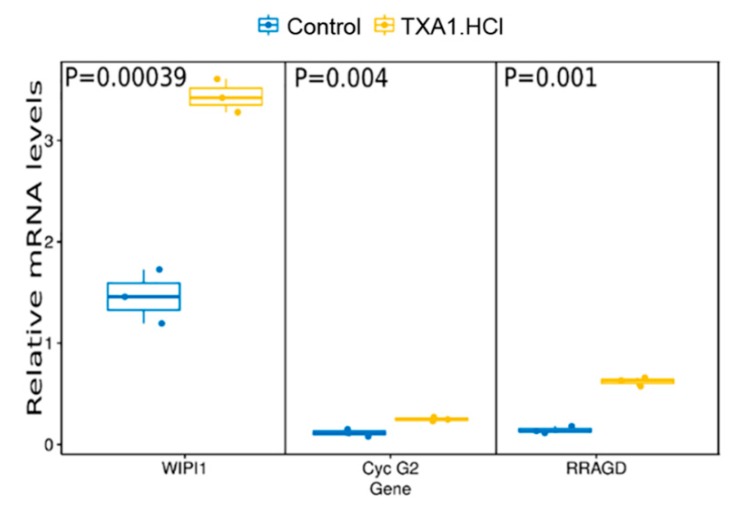
Figure 7.
TXA1.HCl treatment affects WIPI1, Cyclin G2 and RRAGD mRNA expression levels, confirmed by quantitative real-time PCR. Values are expressed after normalization for an endogenous control (Hprt1). Data plotted with ggplot and p values were calculated using t. test in R statistical programming language, comparing TXA1.Hcl treatment vs control.

