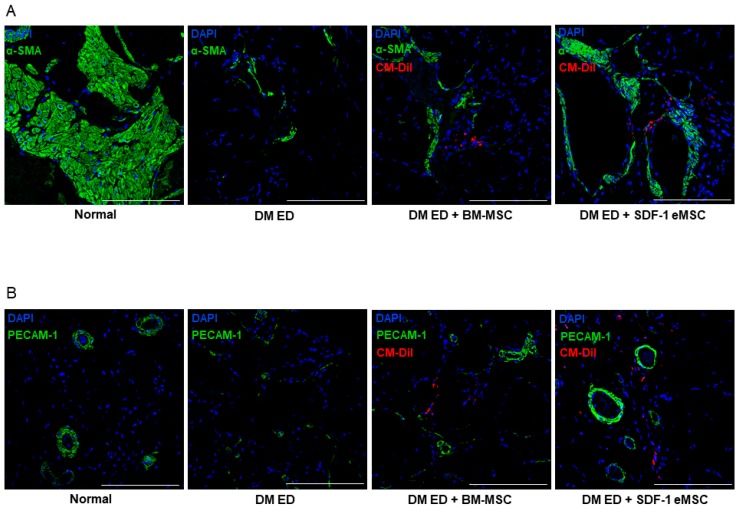
Figure 3.
Representative images of immunofluorescence staining in the corpus cavernosum after treatment with mesenchymal stem cells (MSCs). (A) Representative images of α-SMA staining for each group. Red indicates MSCs, green represents α-SMA, and blue represents cell nuclei. Scale bar: 100 μm. Original magnification: ×200; (B) Representative images of PECAM-1 staining for each group. Red indicates MSCs, green is PECAM-1, and blue represents cell nuclei. Original magnification: ×200.

