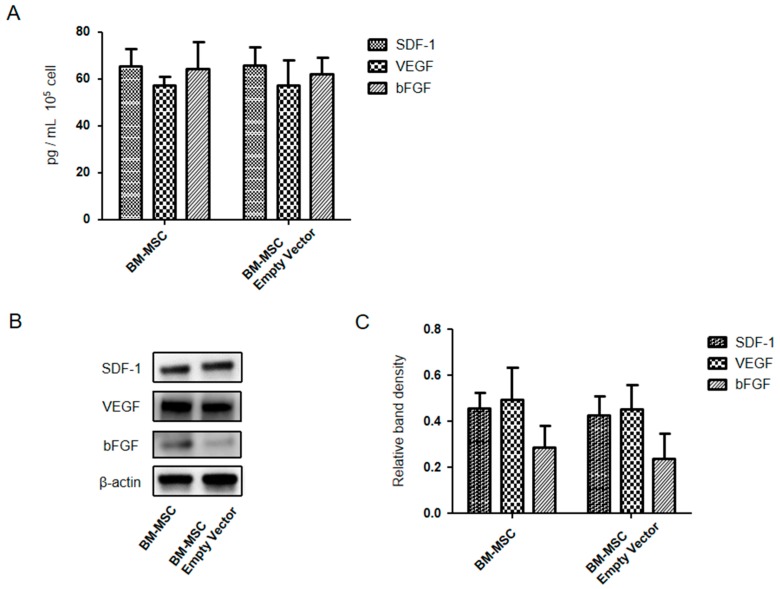
Figure 9.
In vitro expression levels of SDF-1, VEGF, and bFGF were compared between BM-MSCs and empty vector engineered BM-MSCs passage 10 by quantitative ELISA and western blotting. (A) SDF-1, VEGF, and bFGF concentration in vitro by ELISA; (B) Expression levels of SDF-1, VEGF, and bFGF in vitro by western blotting; (C) Relative density of bands in the western blot analysis for each group.

