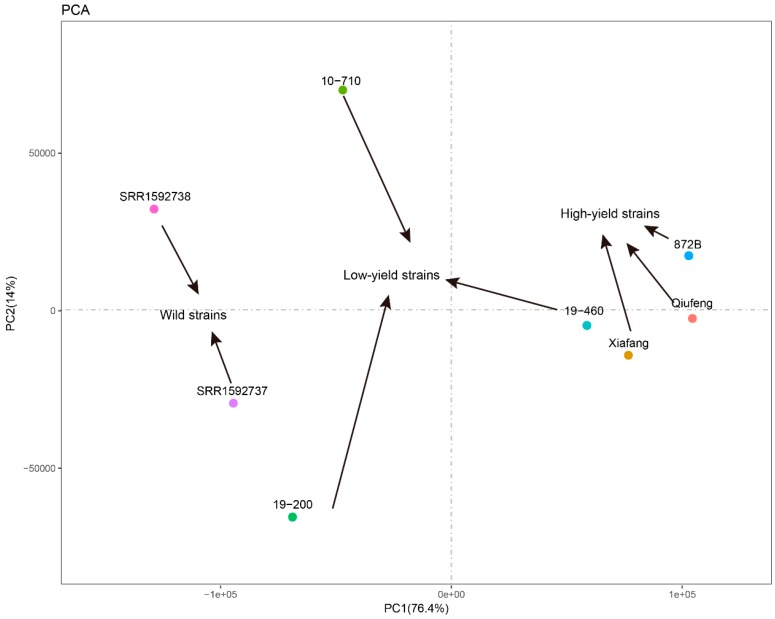
Figure 7.
Principal component analysis (PCA). The numbers 1, 2, and 6 represent high-yield strains; 3, 4, and 5 indicate low-yield strains; and w1 and w2 are wild silkworms. The wild silkworm transcriptome data, w1 and w2, were derived from a comparative analysis of the silk gland transcriptomes between the domestic and wild silkworms [Fang et al. BMC Genomics (2015)].

