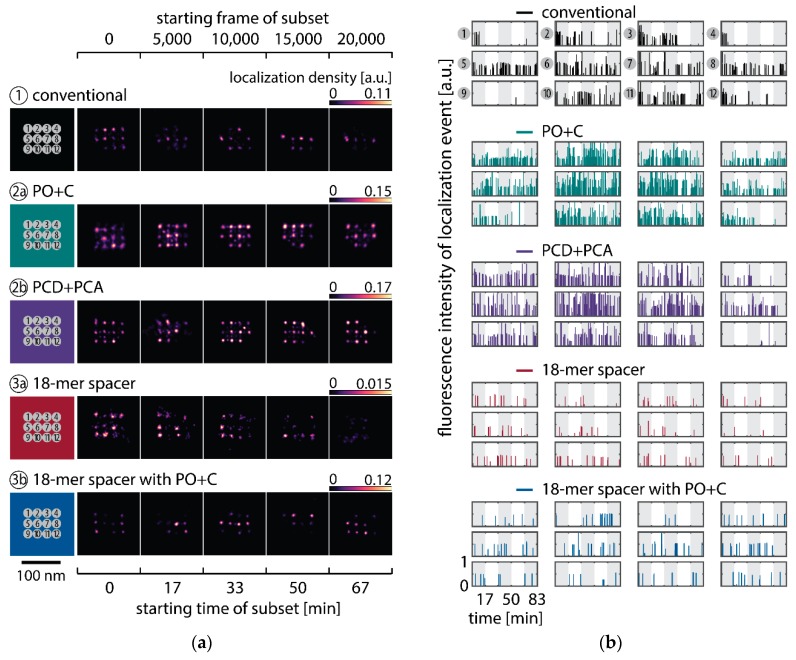
Figure 2.
Long DNA-PAINT acquisition of DNA origami nanostructures with 12 exposed docking strands arranged in a 3 × 4 grid with 20 nm spacing. Five conditions are displayed: conventional imager (1, black), conventional imager with oxygen scavenging system added (2a: PO+C, turquoise; 2b: PCD+PCA, purple), imager with 18-mer spacer between docking sequence and fluorescent dye (3a, red) and the 18-mer spacer with PO+C (3b, blue). (a) Time series of representative super-resolved DNA-PAINT images, reconstructed from five subsequent 5,000 frame long subsets of a 25,000 frame long acquisition (in total 83 min). Additional examples are listed in the Appendix A (Figure A3). Scale Bar: 100 nm. (b) Time traces of localizations within circular areas picked as individual bindings sites. The alternating shade of the background indicates the five subsets. DNA-PAINT raw data is available as Supplementary Material.

