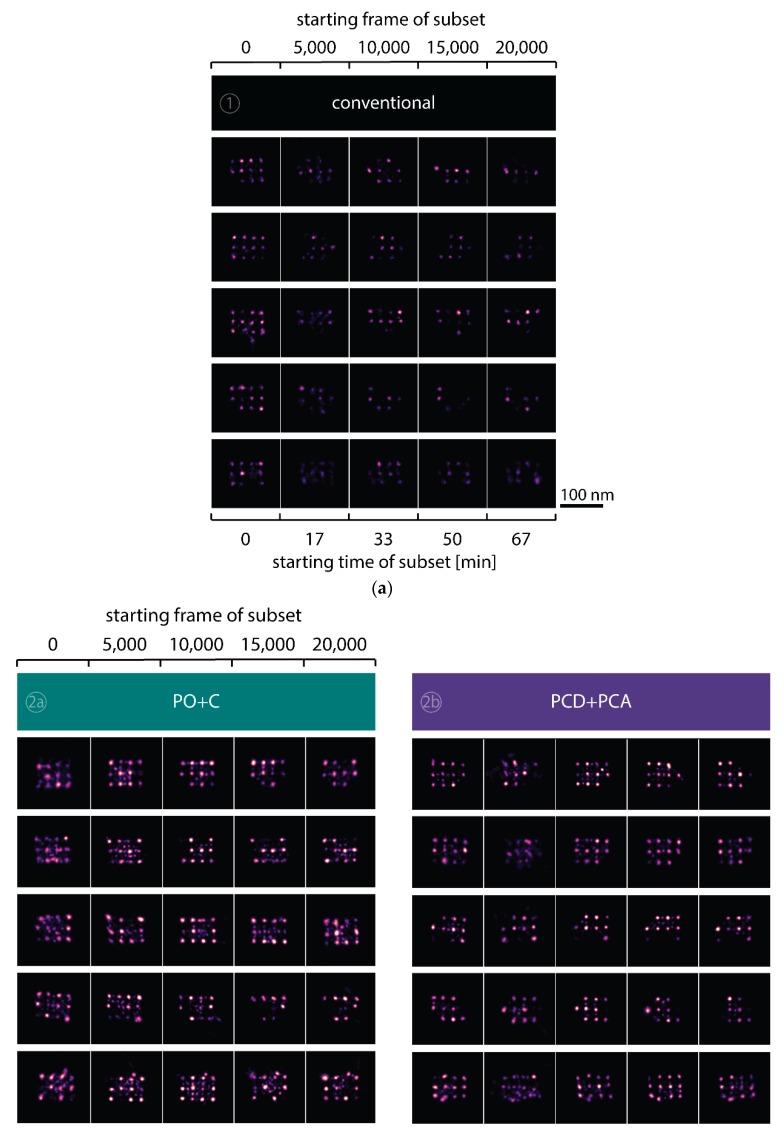
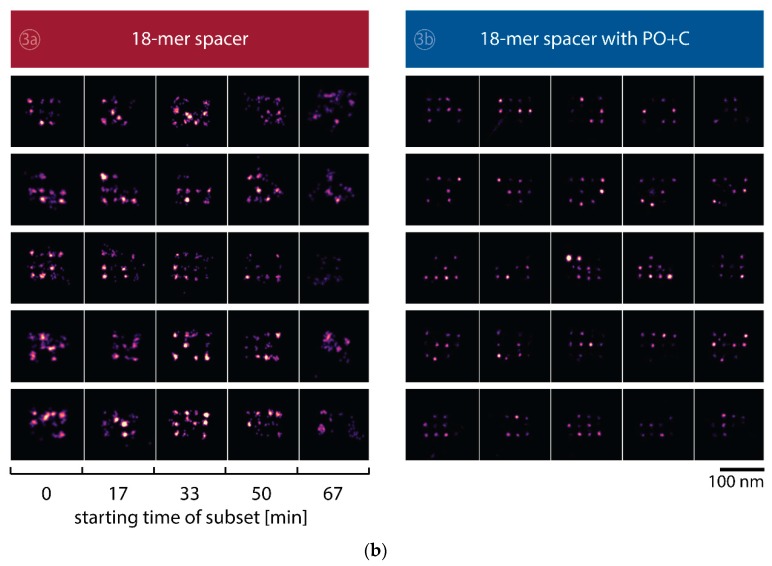
Figure A3.
Selected DNA-PAINT super-resolved images of DNA nanostructures showing the depletion of binding sites in the five different conditions. (a) Images for the conventional imager (1). Five rows display different nanostructures that showed a high number of initially available docking sites. Images along the five columns represent the localizations within a subset of 5000 frames from a 25,000 frame long measurement. Scale bar: 100 nm. (b) Images taken with addition of the oxygen scavenging buffer PO+C (2a), PCD+PCA (2b), extension with an 18-mer spacer (3a) and the combination of 18-mer spacer and PO+C (3b).


