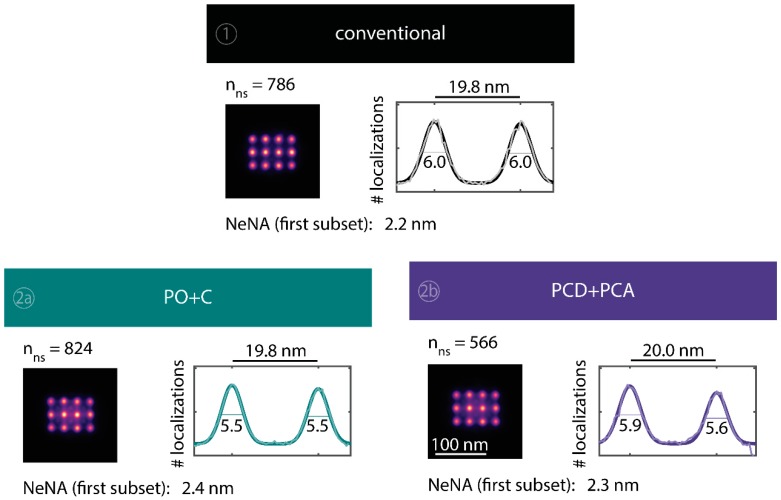
Figure A4.
Averaged super-resolved DNA-PAINT images of DNA origami nanostructures for the whole time series of 83 min. The total numbers of identified DNA origami nanostructures employed for averaging are stated above the average images. Line profiles of total number of localizations through the two lower left points from each averaged image were fitted with a double Gaussian function . The number stated for each peak is the FWHM (in nm) and can be interpreted as a measure of the achievable resolution; the peak-to-peak distance is shown above the plot. Additionally, the value of the nearest neighbor analysis (NeNA) [11,75] is shown for the first subset.


