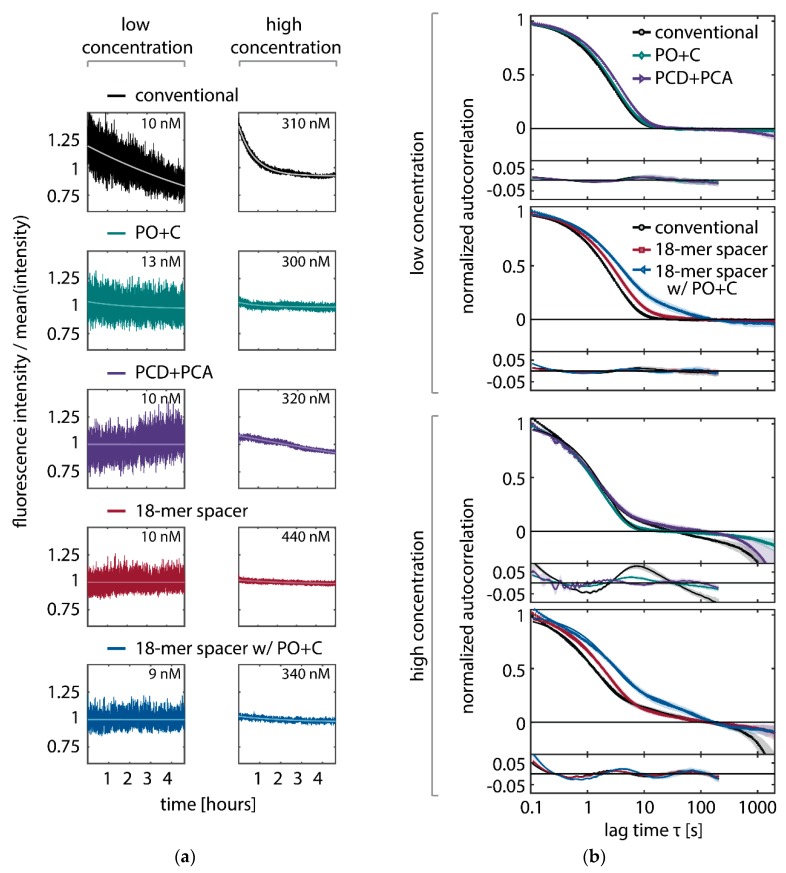
Figure A7.
Influence of the depletion of binding sites on the autocorrelation function: (a) Decays of the integrated fluorescence intensity within a representative region of interest (dark shade) and fit of the mono-exponential detrending function (Equation (1), light shade). For all five conditions (conventional, addition of oxygen scavenging system (PO+C and PCD+PCA), 18-mer spacer and 18-mer spacer with PO+C) an example at low and high concentration is shown. The concentrations of individual samples were measured by confocal FCS. (b) Representative normalized autocorrelation functions and residuals with conditions as in (a) (solid lines). Shaded areas represent the standard deviation from 64 regions of interest.

