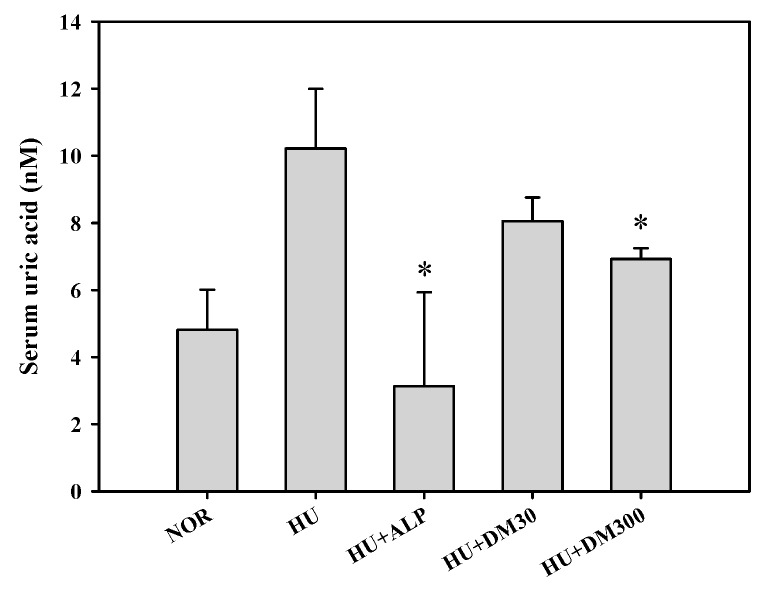
Figure 2.
Serum uric acid levels after the oral administration of saline in normal mice (NOR) and after the oral administration of saline (HU), allopurinol at a dose of 10 mg/kg (HU + ALP), or DM at doses of 30 mg/kg (HU + DM30) and 300 mg/kg (HU + DM300) in hyperuricemic mice for 7 days. The rectangular bars and their error bars represent the means and standard deviations, respectively (n = 5). The asterisks indicate values that are significantly different from those of the HU group (p < 0.05).

