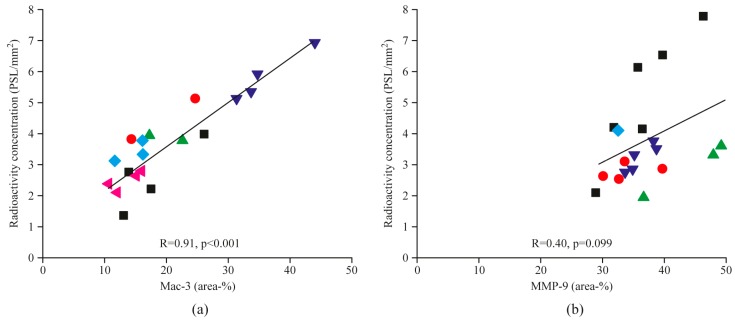
Figure 4.
Scatter plots show correlations between areal percentages of Mac-3-positive macrophages (a), or MMP-9 (b), and corresponding [68Ga]Ga-DOTA-TCTP-1 uptake in the atherosclerotic plaques. Each symbol type represents plaques from the same animal. R, Pearson’s rank correlation coefficient; PSL, photostimulated luminescence.

