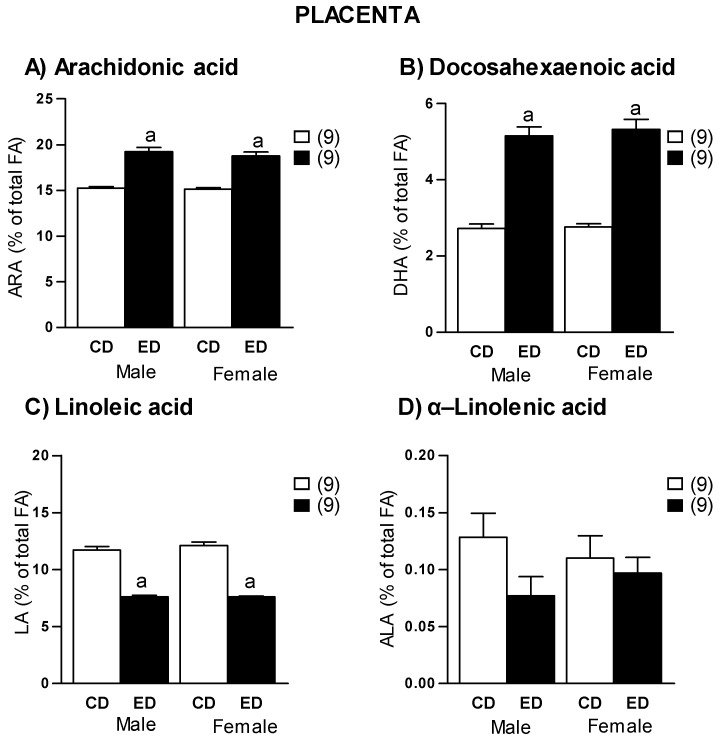
Figure 4.
Placental levels of (A) Arachidonic acid (ARA), (B) docosahexaenoic acid (DHA), (C) linoleic acid (LA), and (D) α-Linolenic acid (ALA) in dams fed with control diet (CD) and experimental diet (ED), separated by sex. Data show mean ± SEM. Between parenthesis, the litter sample size is shown (from each litter 2–3 placentas of each sex were averaged). Student’s t test. a p < 0.001 ED versus CD.

