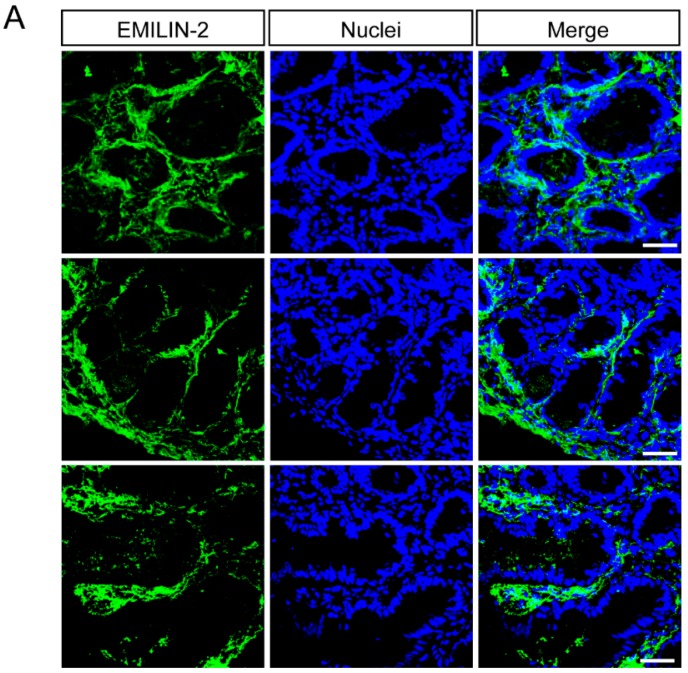
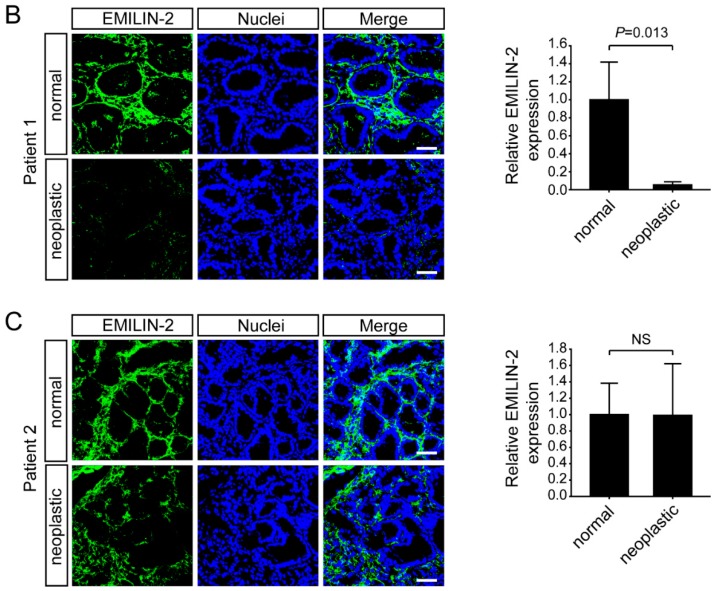
Figure 3.
EMILIN-2 expression is decreased in some gastric cancer patients. (A) Representative images of normal gastric mucosa samples stained with anti-EMILIN-2 (green). Nuclei were stained with TO-PRO® 3 (blue). Scale bar = 50 μm. (B) Images and quantification of the expression of EMILIN-2 (green) in normal and in gastric cancer samples from Patient 1. Nuclei were stained with TO-PRO® 3 (blue). Scale bar = 50 μm. (C) Representative images and quantification of the expression of EMILIN-2 (green) in normal and in gastric cancer samples from Patient 2. Nuclei were stained with TO-PRO® 3 (blue). Scale bar = 50 μm. Graphs represent the mean ± SD; p values were obtained using the paired Student’s t-test. NS: not significant.


