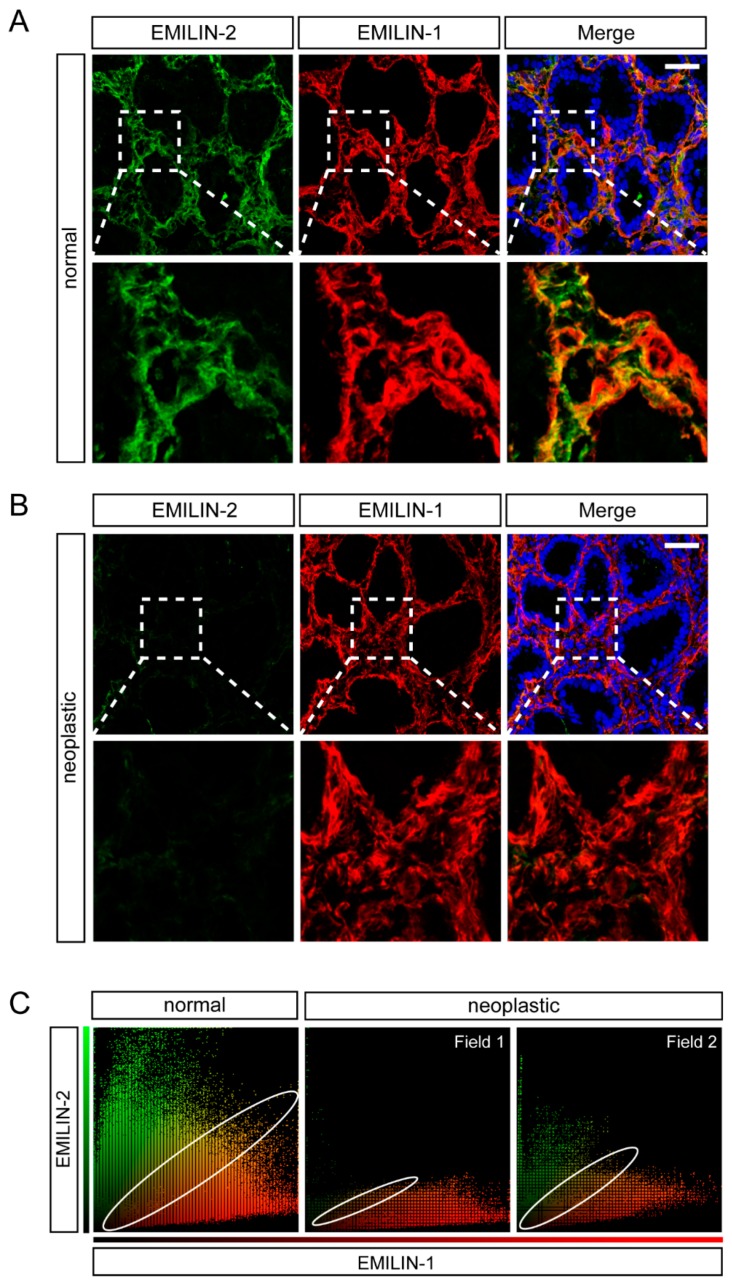
Figure 5.
EMILIN-2 and EMILIN-1 expression partially co-localizes in the gastric lamina propria. (A) Representative images of the distribution of EMILIN-2 (green) and EMILIN-1 (red) in the normal gastric mucosa. Nuclei were stained with TO-PRO® 3 (blue). Scale bar = 50 μm. Magnifications (3.8×) are shown in the bottom panels. (B) Representative images of the distribution of EMILIN-2 (green) and EMILIN-1 (red) in gastric cancer samples. Nuclei were stained with TO-PRO® 3 (blue). Scale bar = 50 μm. Magnifications (3.8×) are shown in the bottom panels. (C) Scatter plots from the analysis of EMILIN-2 (green) and EMILIN-1 (red) co-localization in normal and gastric cancer samples as evaluated with the Volocity software. The extent of co-localization (yellow dots) is highlighted by an ellipse.

