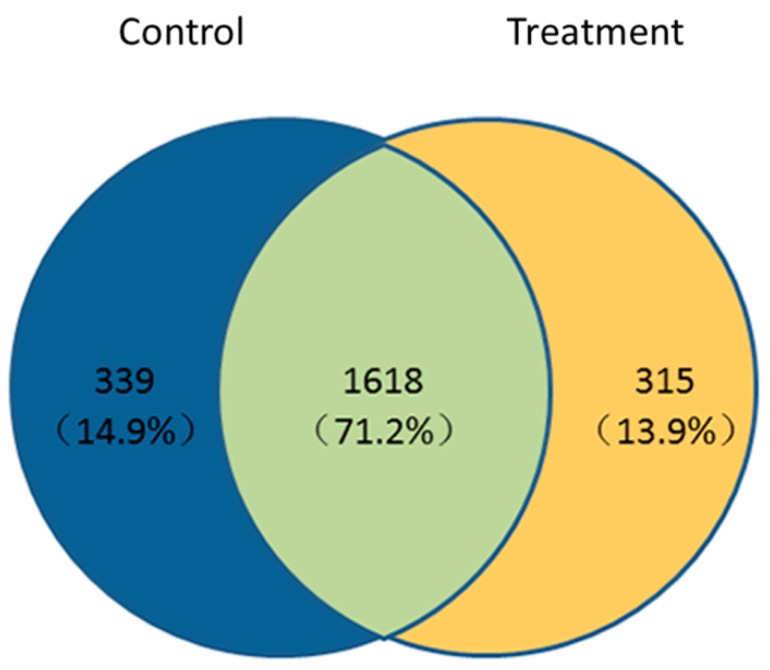
Figure 5.
The changed in the proteome distribution between the control (CK + TMV) and treatment (A13 + TMV) groups, the diagram shows both unique and shared proteins. Blue indicates DEPs were identified in the control, orange indicates DEPs were identified in the treatment, and green indicates DEPs were identified in both treatment groups.

