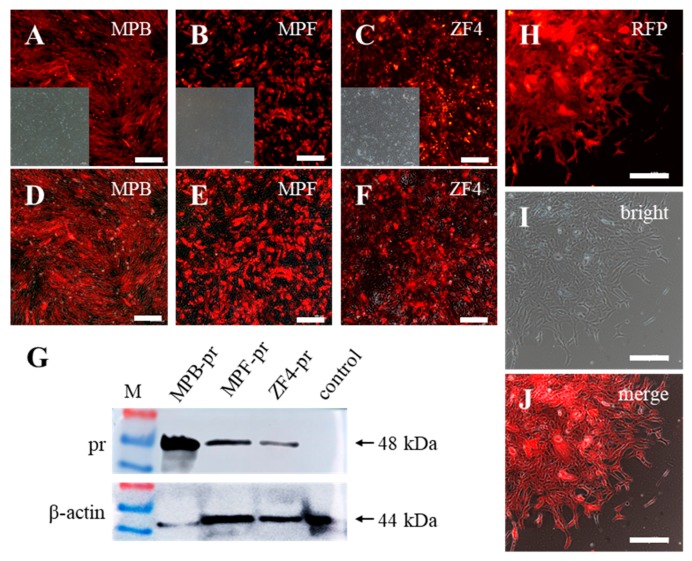
Figure 3.
Expressions of RFP in stably integrated fish cell lines. (A–F) Expression of RFP in stable MPB, MPF, and ZF4 cells after baculovirus transduction and drug selection. (A–C) are images caught at red fluorescence and bright. (D–F) are merged images. (G) Western blot results of Puromycin-RFP (Pr) protein (48 kDa) in stably transduced MPB, MPF, and ZF4 and un-transduced control cell lines. M represents protein markers. (H–J) Monoclonal cell growth assay of stably transduced MPF cells. The expression of RFP was observed under an inverted fluorescence microscope. Scale bars, 200 μm.

