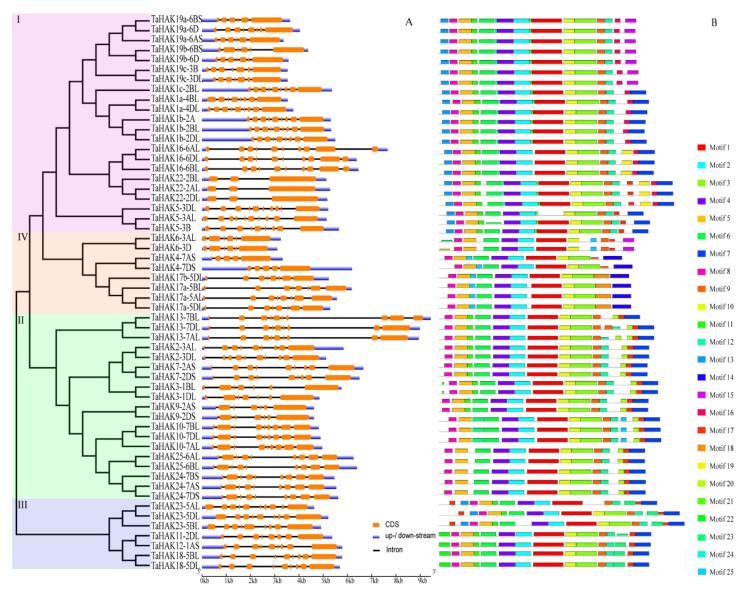
Figure 3.
Gene structures and conserved protein motifs of TaHAKs. (A) Gene structures. TaHAK genes are displayed in order based on a phylogenetic analysis of their protein products. Introns, exons and noncoding regions are represented with black lines, orange boxes and blue boxes, respectively. (B) Conserved protein motifs. Twenty-five motifs identified in TaHAK proteins marked by different colors.

