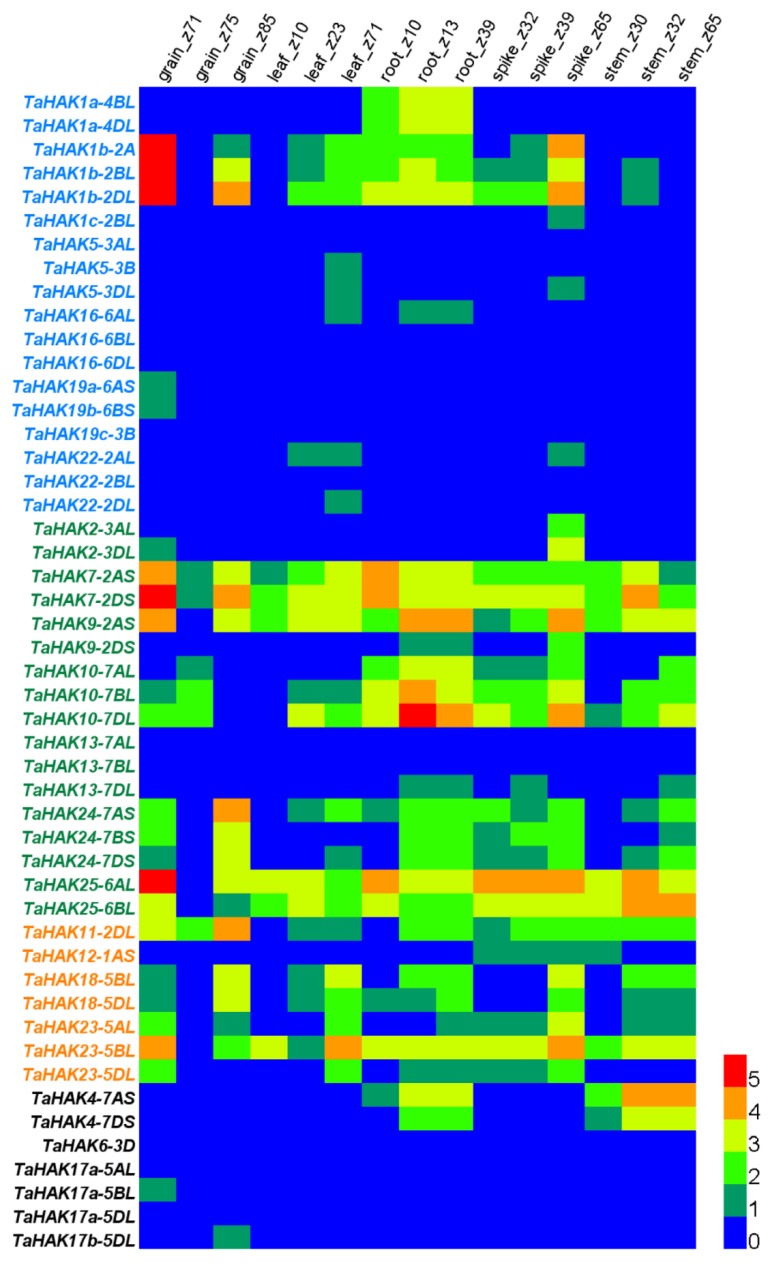
Figure 4.
Heat map showing the expression of wheat TaHAK genes in various wheat tissues at different developmental stages. RNA-seq data for bread wheat cultivar Chinese spring were obtained from dataset “developmental timecourse in five tissues” presented in WheatExp database [31] Number 0 to 5 represent the range of expression levels (from the lowest to the highest) of the examined genes.

