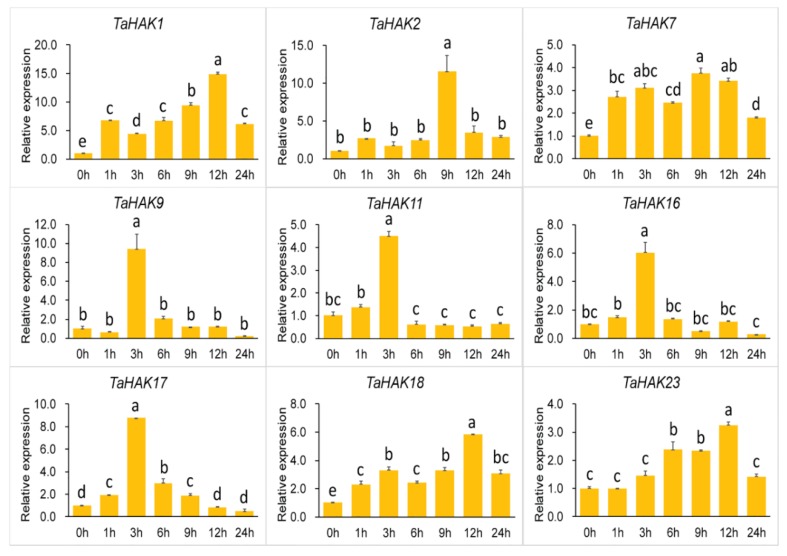
Figure 5.
Expression of TaHAK genes in response to potassium deficiency stress (0.1 mM K+). Expression of TaHAK genes was determined by qRT-PCR using total RNA isolated from wheat roots at different time points (0, 1, 3, 6, 9, 12 and 24 h) of the potassium deficiency stress. One-way ANOVA with Duncan’s multiple range test was conducted using SPSS version 20.0. Different letters on top of error bars indicate significant differences at p = 0.05 level. Error bars indicate the standard error (SE) of three replicates.

