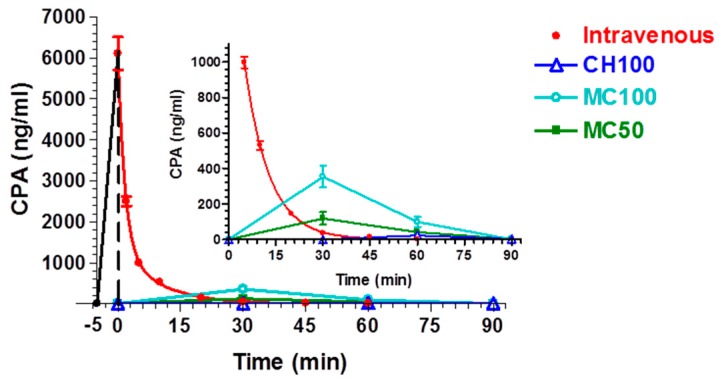
Figure 6.
Blood CPA concentrations (ng/mL) after infusion or nasal administration of a 200-μg dose. The time ranging from −5 to 0 min refers to CPA IV infusion. In the inset: zoom of the same plot with expanded Y-scale (CPA blood concentration) from 0 to 1000 ng/mL. The inset highlights the concentration values obtained after administration of CH100, MC100 and MC50. Data are expressed as the mean ± standard deviation, n = 4.

