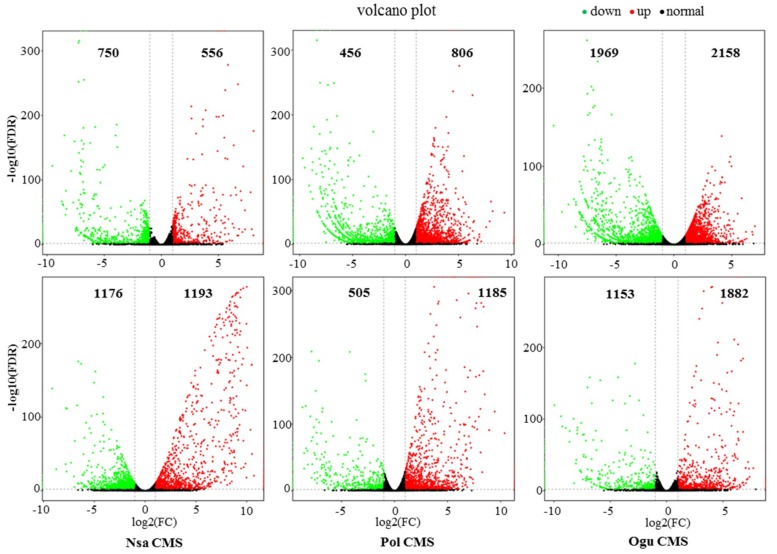
Figure 4.
Differentially expressed unigenes and corresponding genes in the sterile and maintainer lines. The genes were selected with “p ≤ 0.01” and “fold change ≥2”. The X-axis is the log of 2-fold change in expression between the sterile and maintainer lines at two stages. Y-axis shows the statistical significance of the differences with the value of log10 (FDR). The spots in different colors are representing expression of different genes. Black spots represent genes without significant expression. Red spots mean 2-fold upregulated genes from maintainer lines to sterile lines. Green spots represent significantly 2-fold down-expressed genes from maintainer lines to sterile lines.

