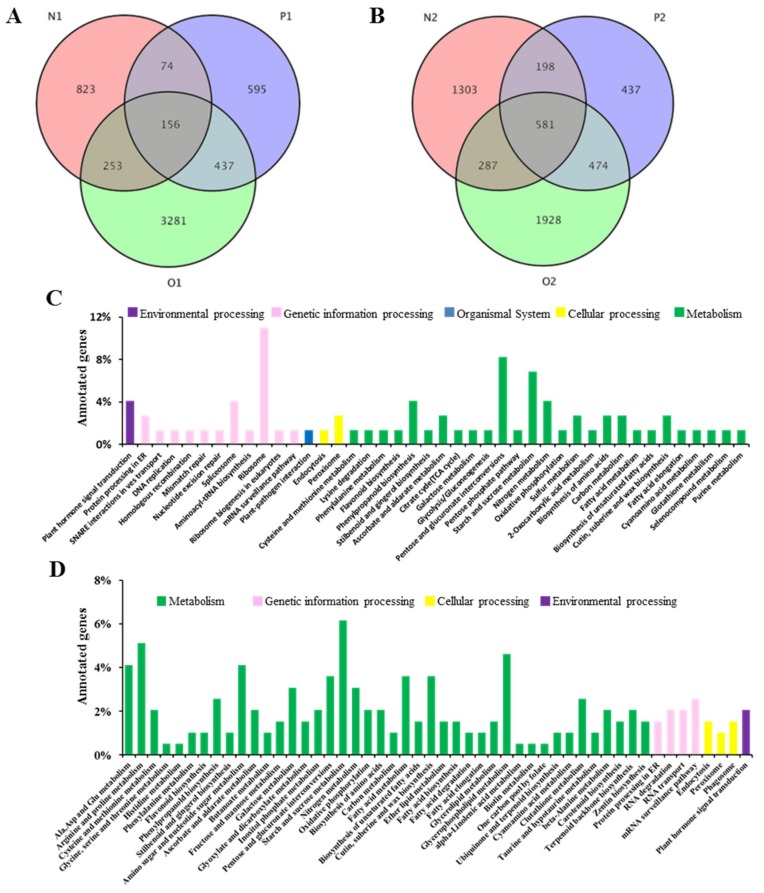
Figure 5.
Co-differentially expressed unigenes (A, B) and GO annotations (C, D) of differentially expressed genes (DEGs). Venn diagrams of differentially expressed genes at (A) the S1 stage and (B) the S2 stage in Nsa (N), Ogu (O), and Pol (P) male sterile lines. N1, S1 stage of Nsa CMS system; O1, S1 stage of Ogu CMS system; P1, S1 stage of Pol CMS system; N2, S2 stage of Nsa CMS system; O2, S2 stage of Ogu CMS system; P2, S2 stage of Pol CMS system; (C) and (D), the X-axis indicates the percentage of genes in each categories, and y-axis showed classification of unigenes.

