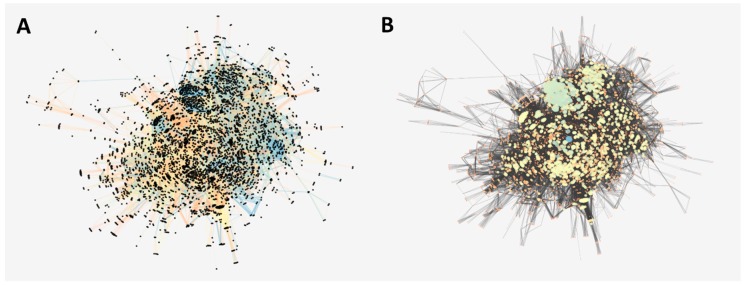
Figure 3.
(A) Interaction network of T. cruzi strain CL Breiner. The nodes (proteins) are presented in black and the score associated with the interaction is presented in colors, blue being more reliable than orange. (B) Interaction network of T. cruzi strain CL Breiner. The axes (interactions) are represented in black and on a scale of orange (less connected) to blue (more connected) the nodes (proteins) of the network. The size of the circle indicates its degree of connectivity (degree).

