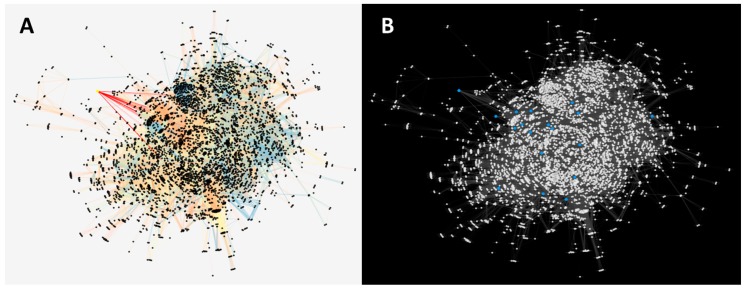
Figure 4.
(A) Protein–protein interaction network with the AKT-like protein signaled in yellow, where the axes that connect with the closest neighboring nodes (located in the center of the network) are highlighted in red. (B) Protein–protein interaction network with proteins represented as white nodes, and in blue are those that were mapped with the PI3K/AKT/mTOR pathway of human proteins.

