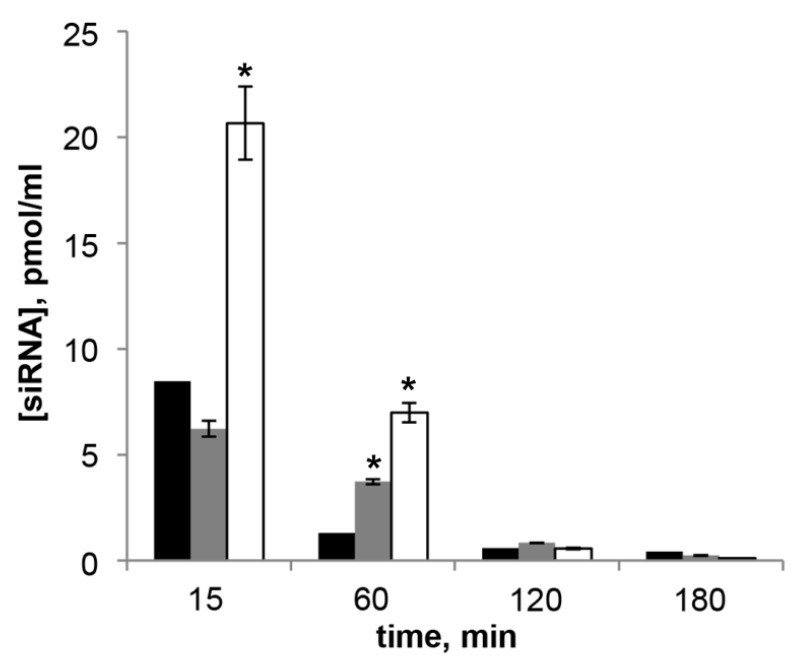
Figure 5.
Concentration of siMDR measured by stem-loop PCR in blood plasma of CBA/LacSto mice 15–180 min after i.v. injection of L/siMDR (black bars), P800/siMDR (grey bars) or P2000/siMDR (white bars) lipoplexes formed at N/P = 4/1. The data represent means ± standard deviation (SD) (n = 3). The differences between mean values for L and other preparations at the same N/P were considered statistically significant * p < 0.01 (Mann-Whitney U-test).

