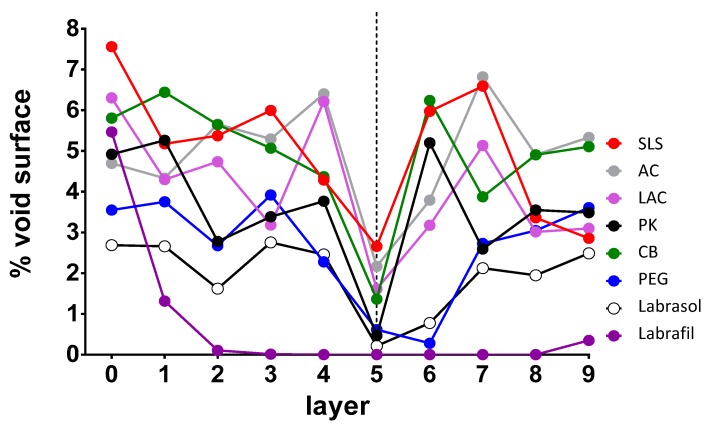
Figure 6.
Representation of the critical surface obtained for each enhancer depending on the assessed plane. 0 represents the upper surface of the model and 9 the lower surface. AC: acetylcysteine, CB: carbocysteine, SLS: sodium lauryl sulfate, PK: potassium phosphate, PEG: polyethylene glycol 300, LAC: lactic acid. The dashed line represents the critical surface layer that has the minimum values of the void surface in the majority of model samples.

