Figure 2.
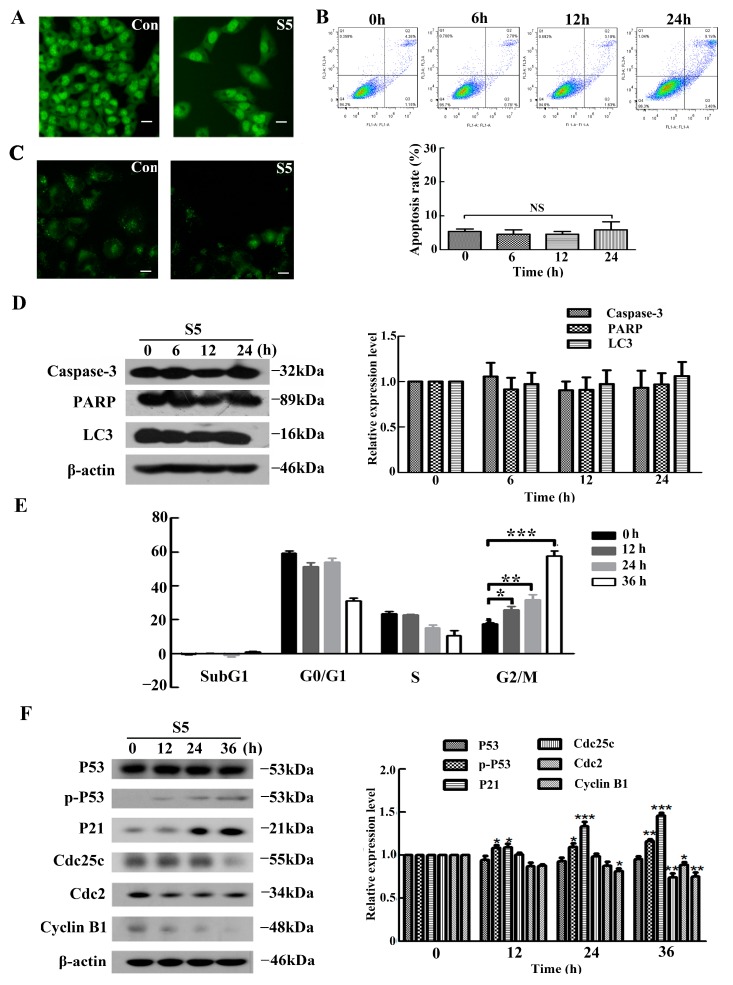
S5 induces G2/M arrest in A375 cells. (A) Nuclear morphology shown via AO staining of A375 cells treated with 40 μM of S5 for 24h. Bar represents 25 µm. (B) Induction of apoptosis was determined via staining with annexin V/propidium iodide (PI) and flow cytometric analysis. Values are expressed as mean ± SD. (C) The cellular morphologic changes were observed under fluorescence microscopy with MDC staining after being treated with 40 μM of S5 for 24 h. Bar represents 50 µm. (D) Western blot analysis of caspase3 LC3 and PARP expression levels in A375 cells after S5 treatments for 0, 6, 12, and 24 h. (E) The cells were cultured with 40 μM of S5 for 0, 12, 24, and 36h. The DNA content was analyzed using flow cytometry after PI staining. The percentage of cells in different phases of the cell cycle was represented using a bar diagram. Data from a representative experiment are shown. n = 3, mean ± SD. * p < 0.05, ** p < 0.01, *** p < 0.001. (F) S5 affected the expression of p-P53 and proteins involved in regulating the G2/M transition. The cells were lysed for protein extraction. Samples (25 μg) were subjected to 10% sodium dodecyl sulfate polyacrylamide gel electrophoresis (SDS-PAGE) and western blotting for the detection of specific proteins. All blots are representative of at least three repeats.

