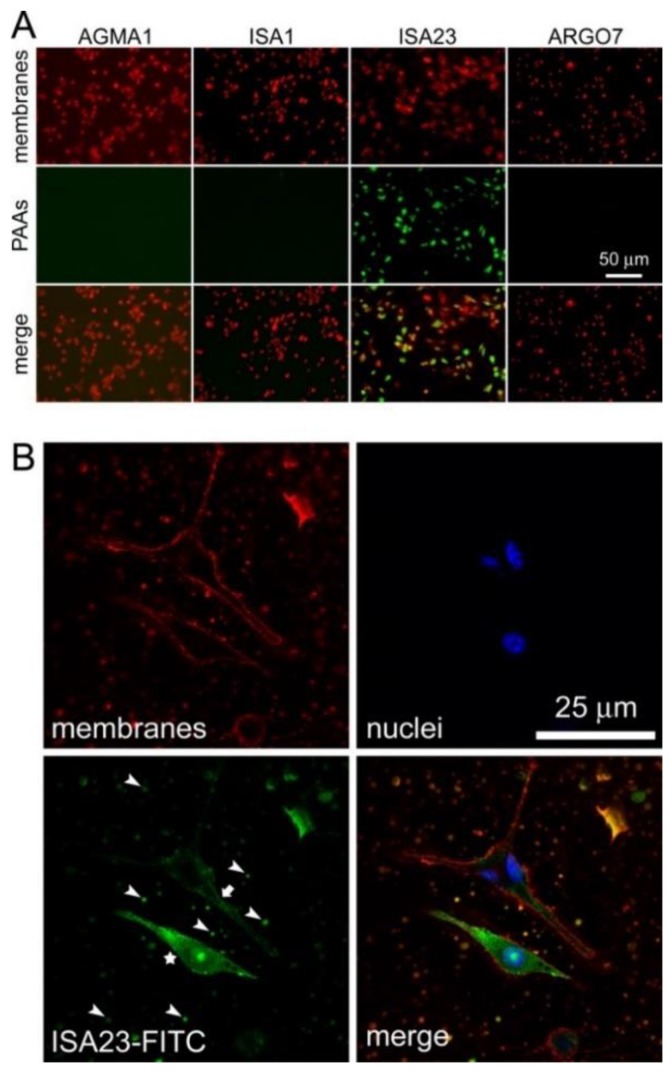
Figure 3.
Fluorescence microscopy analysis of PAA-FITC uptake by macrophages. (A) Conventional fluorescence microscopy of all PAA samples. (B) Confocal fluorescence microscopy of the ISA23-FITC sample. Two macrophages are shown, one with intense intracellular FITC labeling (star) and another with plasma membrane labeling (arrow). Arrowheads point at some of the abundant vesicular structures present in the culture that have also incorporated the polymer.

