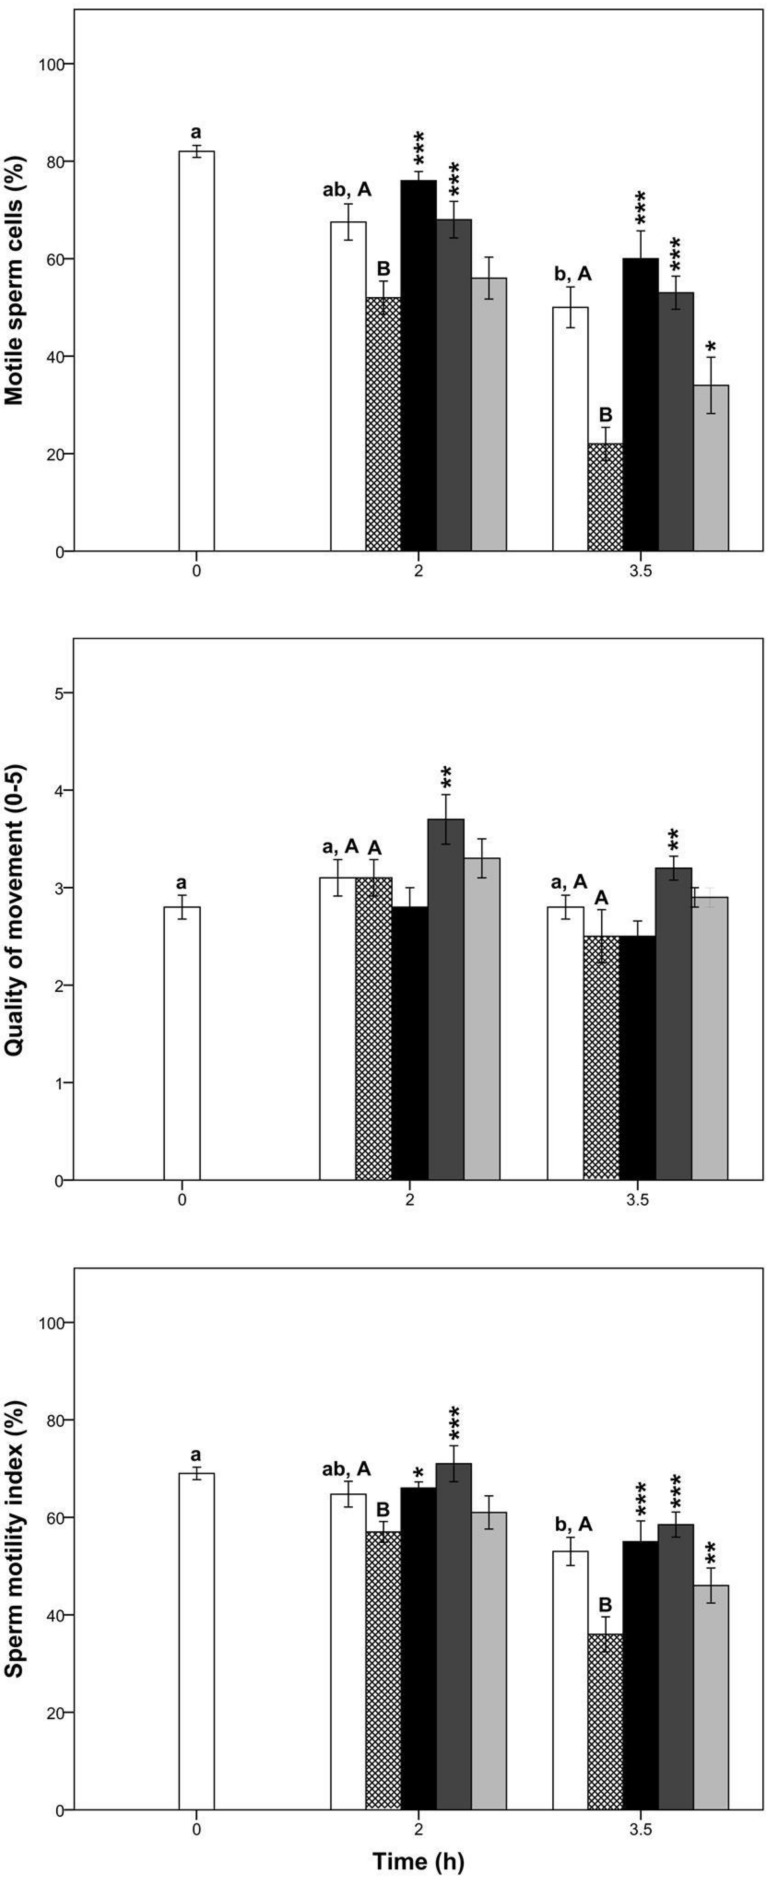
Figure 1.
Percentage of motile sperm cells, quality of movement, and sperm motility index in boar samples submitted to oxidative stress (CTR except) and supplemented with aminoguanidine. Different superscript lower-case letters indicate significant differences (p < 0.05) among times for the control group without induced oxidative stress. Different superscript upper-case letters indicate significant differences (p < 0.05) between the control group with and without induced oxidative stress within each given time. The asterisks indicate significant differences between the treatment and the control submitted to induced oxidative stress within each given time (* p < 0.05; ** p ≤ 0.01; *** p ≤ 0.001). White bars = control samples; crossed bars = control samples under induced oxidative stress; black bars = 10 mM aminoguanidine; dark grey bars = 1 mM aminoguanidine; and light grey bars = 0.1 mM aminoguanidine. Data are shown as mean ± standard error of 5 replicates.

